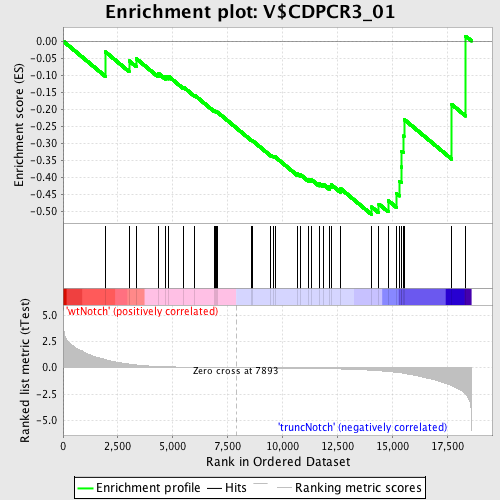
Profile of the Running ES Score & Positions of GeneSet Members on the Rank Ordered List
| Dataset | Set_03_truncNotch_versus_wtNotch.phenotype_truncNotch_versus_wtNotch.cls #wtNotch_versus_truncNotch.phenotype_truncNotch_versus_wtNotch.cls #wtNotch_versus_truncNotch_repos |
| Phenotype | phenotype_truncNotch_versus_wtNotch.cls#wtNotch_versus_truncNotch_repos |
| Upregulated in class | truncNotch |
| GeneSet | V$CDPCR3_01 |
| Enrichment Score (ES) | -0.508941 |
| Normalized Enrichment Score (NES) | -1.208028 |
| Nominal p-value | 0.16984402 |
| FDR q-value | 1.0 |
| FWER p-Value | 1.0 |
| PROBE | DESCRIPTION (from dataset) | GENE SYMBOL | GENE_TITLE | RANK IN GENE LIST | RANK METRIC SCORE | RUNNING ES | CORE ENRICHMENT | |
|---|---|---|---|---|---|---|---|---|
| 1 | CDK2AP1 | 2340156 | 1928 | 0.770 | -0.0317 | No | ||
| 2 | L3MBTL2 | 6020341 | 3010 | 0.339 | -0.0581 | No | ||
| 3 | ZIC4 | 1500082 | 3339 | 0.256 | -0.0517 | No | ||
| 4 | CER1 | 840102 | 4338 | 0.115 | -0.0946 | No | ||
| 5 | UPP2 | 2190091 2680746 6940647 | 4659 | 0.091 | -0.1033 | No | ||
| 6 | NPAS1 | 5570020 | 4811 | 0.082 | -0.1037 | No | ||
| 7 | SIX1 | 6760471 | 5490 | 0.053 | -0.1353 | No | ||
| 8 | BMP4 | 380113 | 6000 | 0.037 | -0.1592 | No | ||
| 9 | SPP2 | 3840253 | 6878 | 0.017 | -0.2048 | No | ||
| 10 | MYT1 | 6770524 | 6942 | 0.016 | -0.2067 | No | ||
| 11 | CRH | 3710301 | 6973 | 0.016 | -0.2068 | No | ||
| 12 | FGF7 | 5390484 | 7023 | 0.015 | -0.2081 | No | ||
| 13 | ZIC1 | 670113 | 8581 | -0.011 | -0.2908 | No | ||
| 14 | BHLHB3 | 3450438 | 8625 | -0.012 | -0.2920 | No | ||
| 15 | PIP5K1A | 4560672 | 9471 | -0.026 | -0.3350 | No | ||
| 16 | NFIA | 2760129 5860278 | 9571 | -0.028 | -0.3377 | No | ||
| 17 | PAK3 | 4210136 | 9658 | -0.029 | -0.3396 | No | ||
| 18 | SIX3 | 3830402 | 10676 | -0.051 | -0.3896 | No | ||
| 19 | NTN1 | 5700600 | 10809 | -0.054 | -0.3916 | No | ||
| 20 | LPHN2 | 4480010 | 11174 | -0.063 | -0.4053 | No | ||
| 21 | FGF10 | 730458 840706 | 11328 | -0.068 | -0.4072 | No | ||
| 22 | HOXA4 | 940152 | 11666 | -0.078 | -0.4180 | No | ||
| 23 | CNTN6 | 2630711 | 11850 | -0.085 | -0.4199 | No | ||
| 24 | SP6 | 60484 510452 2690333 | 12130 | -0.096 | -0.4260 | No | ||
| 25 | PPARG | 1990168 2680603 6130632 | 12221 | -0.100 | -0.4215 | No | ||
| 26 | MARK1 | 450484 | 12657 | -0.121 | -0.4335 | No | ||
| 27 | PTGFRN | 4120524 | 14059 | -0.237 | -0.4867 | Yes | ||
| 28 | CSMD3 | 1660427 1940687 | 14391 | -0.280 | -0.4783 | Yes | ||
| 29 | DLX5 | 5130519 6040021 | 14815 | -0.353 | -0.4680 | Yes | ||
| 30 | TCF1 | 5390022 | 15199 | -0.435 | -0.4479 | Yes | ||
| 31 | POU2F1 | 70577 430373 4850324 5910056 | 15328 | -0.468 | -0.4110 | Yes | ||
| 32 | ETV3 | 5360487 | 15415 | -0.493 | -0.3694 | Yes | ||
| 33 | IRAK1 | 4120593 | 15431 | -0.499 | -0.3234 | Yes | ||
| 34 | FOXB1 | 4920270 5290463 | 15513 | -0.527 | -0.2784 | Yes | ||
| 35 | POU3F4 | 870274 | 15540 | -0.535 | -0.2297 | Yes | ||
| 36 | RBPMS | 3990494 | 17716 | -1.713 | -0.1862 | Yes | ||
| 37 | HES1 | 4810280 | 18347 | -2.504 | 0.0145 | Yes |

