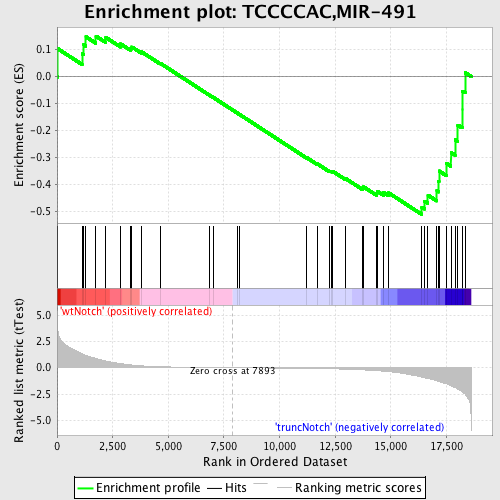
Profile of the Running ES Score & Positions of GeneSet Members on the Rank Ordered List
| Dataset | Set_03_truncNotch_versus_wtNotch.phenotype_truncNotch_versus_wtNotch.cls #wtNotch_versus_truncNotch.phenotype_truncNotch_versus_wtNotch.cls #wtNotch_versus_truncNotch_repos |
| Phenotype | phenotype_truncNotch_versus_wtNotch.cls#wtNotch_versus_truncNotch_repos |
| Upregulated in class | truncNotch |
| GeneSet | TCCCCAC,MIR-491 |
| Enrichment Score (ES) | -0.51275307 |
| Normalized Enrichment Score (NES) | -1.2305026 |
| Nominal p-value | 0.16557378 |
| FDR q-value | 1.0 |
| FWER p-Value | 1.0 |
| PROBE | DESCRIPTION (from dataset) | GENE SYMBOL | GENE_TITLE | RANK IN GENE LIST | RANK METRIC SCORE | RUNNING ES | CORE ENRICHMENT | |
|---|---|---|---|---|---|---|---|---|
| 1 | APPBP2 | 5130215 | 37 | 3.469 | 0.1031 | No | ||
| 2 | TMEM24 | 5860039 | 1125 | 1.314 | 0.0844 | No | ||
| 3 | MAPKAP1 | 1660161 2450575 | 1199 | 1.242 | 0.1181 | No | ||
| 4 | KHDRBS1 | 1240403 6040040 | 1297 | 1.152 | 0.1478 | No | ||
| 5 | TRIM33 | 580619 2230280 3990433 6200747 | 1746 | 0.879 | 0.1503 | No | ||
| 6 | PUM1 | 6130500 | 2191 | 0.627 | 0.1454 | No | ||
| 7 | MPV17 | 1190133 4070427 4570577 | 2857 | 0.386 | 0.1213 | No | ||
| 8 | MYST2 | 4540494 | 3317 | 0.262 | 0.1046 | No | ||
| 9 | STC1 | 360161 | 3361 | 0.253 | 0.1099 | No | ||
| 10 | SEMA4G | 5890026 | 3791 | 0.176 | 0.0921 | No | ||
| 11 | CHD4 | 5420059 6130338 6380717 | 4637 | 0.093 | 0.0495 | No | ||
| 12 | GDAP2 | 3780168 | 6861 | 0.018 | -0.0697 | No | ||
| 13 | AKAP1 | 110148 1740735 2260019 7000563 | 7025 | 0.015 | -0.0780 | No | ||
| 14 | DMRT2 | 2630068 | 8085 | -0.003 | -0.1349 | No | ||
| 15 | PDGFRA | 2940332 | 8181 | -0.005 | -0.1399 | No | ||
| 16 | MUCDHL | 5720056 | 11218 | -0.064 | -0.3014 | No | ||
| 17 | NFIB | 460450 | 11693 | -0.079 | -0.3245 | No | ||
| 18 | SEMA6D | 4050324 5860138 6350307 | 12249 | -0.101 | -0.3513 | No | ||
| 19 | TRPV4 | 1190039 3120372 | 12316 | -0.105 | -0.3517 | No | ||
| 20 | APH1A | 4060273 4670465 6450711 | 12392 | -0.108 | -0.3525 | No | ||
| 21 | B4GALT5 | 1230692 | 12944 | -0.138 | -0.3779 | No | ||
| 22 | ITPKA | 6220075 | 13742 | -0.204 | -0.4147 | No | ||
| 23 | SEH1L | 4590563 | 13777 | -0.208 | -0.4102 | No | ||
| 24 | DNAJB5 | 2900215 | 14367 | -0.277 | -0.4335 | No | ||
| 25 | ZBTB4 | 6450441 | 14383 | -0.279 | -0.4258 | No | ||
| 26 | MAP1A | 4920576 | 14671 | -0.329 | -0.4313 | No | ||
| 27 | RNF40 | 3610397 | 14904 | -0.371 | -0.4325 | No | ||
| 28 | TLN1 | 6590411 | 16395 | -0.893 | -0.4857 | Yes | ||
| 29 | ATP2A1 | 110309 | 16523 | -0.949 | -0.4638 | Yes | ||
| 30 | TRIOBP | 940750 1300187 3140072 | 16670 | -1.009 | -0.4411 | Yes | ||
| 31 | GPD1 | 2480095 | 17072 | -1.243 | -0.4250 | Yes | ||
| 32 | AGPAT1 | 610056 | 17152 | -1.298 | -0.3899 | Yes | ||
| 33 | MOCS1 | 2120022 | 17168 | -1.312 | -0.3510 | Yes | ||
| 34 | SMARCD1 | 3060193 3850184 6400369 | 17492 | -1.521 | -0.3223 | Yes | ||
| 35 | TAF10 | 2760020 | 17704 | -1.700 | -0.2821 | Yes | ||
| 36 | CSRP1 | 2810403 | 17891 | -1.880 | -0.2352 | Yes | ||
| 37 | ARL4D | 1570154 | 18013 | -2.022 | -0.1804 | Yes | ||
| 38 | TCF7 | 3800736 5390181 | 18208 | -2.262 | -0.1223 | Yes | ||
| 39 | GIPC1 | 4590348 5570438 5900707 | 18209 | -2.263 | -0.0538 | Yes | ||
| 40 | HPS1 | 2510026 | 18343 | -2.495 | 0.0147 | Yes |

