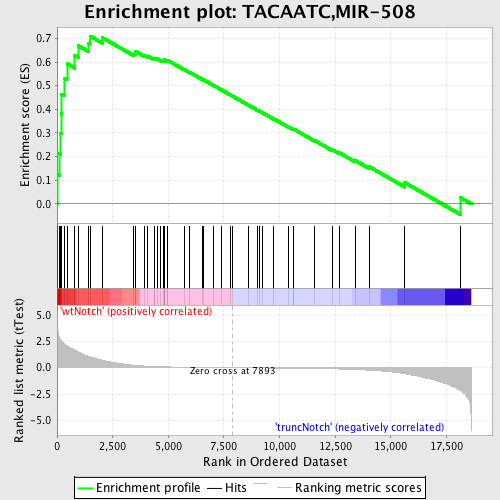
Profile of the Running ES Score & Positions of GeneSet Members on the Rank Ordered List
| Dataset | Set_03_truncNotch_versus_wtNotch.phenotype_truncNotch_versus_wtNotch.cls #wtNotch_versus_truncNotch.phenotype_truncNotch_versus_wtNotch.cls #wtNotch_versus_truncNotch_repos |
| Phenotype | phenotype_truncNotch_versus_wtNotch.cls#wtNotch_versus_truncNotch_repos |
| Upregulated in class | wtNotch |
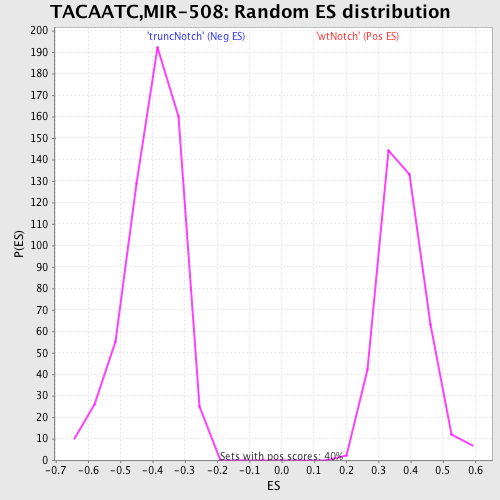
| GeneSet | TACAATC,MIR-508 |
| Enrichment Score (ES) | 0.7098427 |
| Normalized Enrichment Score (NES) | 1.8934536 |
| Nominal p-value | 0.0 |
| FDR q-value | 0.0019697999 |
| FWER p-Value | 0.0060 |
| PROBE | DESCRIPTION (from dataset) | GENE SYMBOL | GENE_TITLE | RANK IN GENE LIST | RANK METRIC SCORE | RUNNING ES | CORE ENRICHMENT | |
|---|---|---|---|---|---|---|---|---|
| 1 | SFRS1 | 2360440 | 15 | 3.775 | 0.1235 | Yes | ||
| 2 | SATB1 | 5670154 | 99 | 2.867 | 0.2135 | Yes | ||
| 3 | FCHSD2 | 5720092 | 167 | 2.628 | 0.2965 | Yes | ||
| 4 | ARPP-19 | 5700025 | 179 | 2.594 | 0.3813 | Yes | ||
| 5 | RANBP9 | 4670685 | 207 | 2.521 | 0.4629 | Yes | ||
| 6 | RNF103 | 840452 | 314 | 2.281 | 0.5323 | Yes | ||
| 7 | VAPA | 2480594 | 447 | 2.065 | 0.5933 | Yes | ||
| 8 | PHTF2 | 6590053 | 795 | 1.656 | 0.6291 | Yes | ||
| 9 | DNAJB1 | 1090041 | 951 | 1.482 | 0.6696 | Yes | ||
| 10 | EIF2C2 | 770451 | 1420 | 1.057 | 0.6792 | Yes | ||
| 11 | HMGN1 | 2650026 | 1478 | 1.024 | 0.7098 | Yes | ||
| 12 | PURB | 5360138 | 2029 | 0.701 | 0.7033 | No | ||
| 13 | NLK | 2030010 2450041 | 3455 | 0.233 | 0.6342 | No | ||
| 14 | PTPN9 | 3290408 | 3517 | 0.220 | 0.6382 | No | ||
| 15 | CLASP1 | 6860279 | 3529 | 0.218 | 0.6448 | No | ||
| 16 | SEPT7 | 2760685 | 3911 | 0.158 | 0.6295 | No | ||
| 17 | NR4A3 | 2900021 5860095 5910039 | 4076 | 0.138 | 0.6252 | No | ||
| 18 | NONO | 7050014 | 4355 | 0.114 | 0.6140 | No | ||
| 19 | KLF4 | 1850022 3830239 5570750 | 4385 | 0.111 | 0.6161 | No | ||
| 20 | SORCS1 | 60411 5890373 | 4496 | 0.102 | 0.6135 | No | ||
| 21 | RSBN1 | 7000487 | 4665 | 0.091 | 0.6075 | No | ||
| 22 | UBP1 | 6020707 | 4790 | 0.083 | 0.6035 | No | ||
| 23 | RAD23B | 2190671 | 4822 | 0.082 | 0.6045 | No | ||
| 24 | PIP5K3 | 5360112 | 4825 | 0.082 | 0.6071 | No | ||
| 25 | GRIA2 | 5080088 | 4832 | 0.081 | 0.6095 | No | ||
| 26 | HMGA2 | 2940121 3390647 5130279 6400136 | 4946 | 0.076 | 0.6059 | No | ||
| 27 | NUMB | 2450735 3800253 6350040 | 4956 | 0.075 | 0.6079 | No | ||
| 28 | MAP2K1IP1 | 6110091 | 5727 | 0.044 | 0.5679 | No | ||
| 29 | BDNF | 2940128 3520368 | 5956 | 0.038 | 0.5568 | No | ||
| 30 | PHYHIPL | 2360706 3840692 | 6539 | 0.024 | 0.5263 | No | ||
| 31 | MITF | 380056 | 6574 | 0.024 | 0.5252 | No | ||
| 32 | FGF7 | 5390484 | 7023 | 0.015 | 0.5016 | No | ||
| 33 | RHOQ | 520161 | 7403 | 0.008 | 0.4815 | No | ||
| 34 | GDF8 | 3850504 | 7786 | 0.002 | 0.4609 | No | ||
| 35 | NDST1 | 1500427 5340121 | 7881 | 0.000 | 0.4559 | No | ||
| 36 | ZBTB33 | 2450014 | 8622 | -0.012 | 0.4164 | No | ||
| 37 | ARHGEF12 | 3990195 | 9001 | -0.018 | 0.3967 | No | ||
| 38 | LHX8 | 5700347 | 9079 | -0.020 | 0.3932 | No | ||
| 39 | GRM8 | 4780082 | 9246 | -0.022 | 0.3850 | No | ||
| 40 | EIF3S1 | 6130368 6770044 | 9736 | -0.031 | 0.3596 | No | ||
| 41 | HOXA1 | 1190524 5420142 | 10414 | -0.045 | 0.3247 | No | ||
| 42 | ARL4C | 1190279 | 10613 | -0.049 | 0.3156 | No | ||
| 43 | HBP1 | 2510102 3130010 4210619 | 10642 | -0.050 | 0.3158 | No | ||
| 44 | VNN3 | 730053 4610609 | 11581 | -0.075 | 0.2677 | No | ||
| 45 | TNPO1 | 730092 2260735 | 12387 | -0.107 | 0.2279 | No | ||
| 46 | CPNE2 | 60551 | 12692 | -0.123 | 0.2156 | No | ||
| 47 | HTR2C | 380497 | 13400 | -0.172 | 0.1832 | No | ||
| 48 | GLCE | 4850040 | 14042 | -0.236 | 0.1564 | No | ||
| 49 | RAPH1 | 6760411 | 15627 | -0.568 | 0.0898 | No | ||
| 50 | DHDDS | 940148 6650184 | 18133 | -2.158 | 0.0260 | No |