Profile of the Running ES Score & Positions of GeneSet Members on the Rank Ordered List
| Dataset | Set_03_truncNotch_versus_wtNotch.phenotype_truncNotch_versus_wtNotch.cls #wtNotch_versus_truncNotch.phenotype_truncNotch_versus_wtNotch.cls #wtNotch_versus_truncNotch_repos |
| Phenotype | phenotype_truncNotch_versus_wtNotch.cls#wtNotch_versus_truncNotch_repos |
| Upregulated in class | truncNotch |
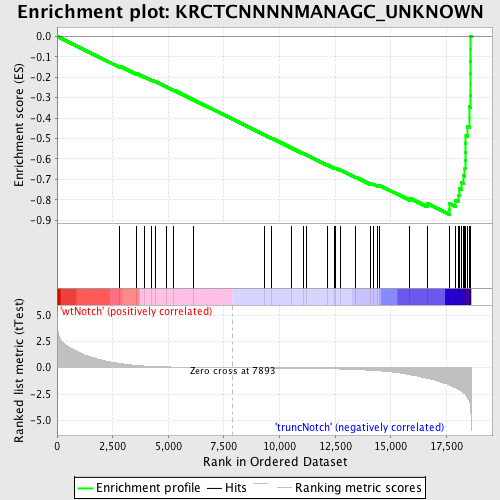
| GeneSet | KRCTCNNNNMANAGC_UNKNOWN |
| Enrichment Score (ES) | -0.8720424 |
| Normalized Enrichment Score (NES) | -2.149541 |
| Nominal p-value | 0.0 |
| FDR q-value | 0.0 |
| FWER p-Value | 0.0 |
| PROBE | DESCRIPTION (from dataset) | GENE SYMBOL | GENE_TITLE | RANK IN GENE LIST | RANK METRIC SCORE | RUNNING ES | CORE ENRICHMENT | |
|---|---|---|---|---|---|---|---|---|
| 1 | HIST1H1C | 3870603 | 2815 | 0.402 | -0.1451 | No | ||
| 2 | NOTCH4 | 2450040 6370707 | 3582 | 0.207 | -0.1830 | No | ||
| 3 | HIST2H2AC | 2030600 | 3924 | 0.156 | -0.1989 | No | ||
| 4 | HIST1H1D | 3440446 | 4240 | 0.124 | -0.2138 | No | ||
| 5 | HIST1H2BE | 6550053 | 4399 | 0.109 | -0.2206 | No | ||
| 6 | HIST3H2A | 1580504 | 4919 | 0.077 | -0.2473 | No | ||
| 7 | DSCAM | 1780050 2450731 2810438 | 5251 | 0.062 | -0.2641 | No | ||
| 8 | HIST1H2AA | 7050100 | 6123 | 0.034 | -0.3105 | No | ||
| 9 | HIST1H2AH | 3710333 | 9338 | -0.024 | -0.4831 | No | ||
| 10 | TCF21 | 2690446 | 9617 | -0.028 | -0.4976 | No | ||
| 11 | SEZ6 | 3450722 | 10551 | -0.048 | -0.5471 | No | ||
| 12 | HIST3H2BB | 70278 | 11067 | -0.061 | -0.5739 | No | ||
| 13 | HIST1H3F | 2320441 2480022 3940170 | 11230 | -0.065 | -0.5815 | No | ||
| 14 | HIST1H1T | 130632 | 12133 | -0.096 | -0.6286 | No | ||
| 15 | GBX2 | 3940736 | 12485 | -0.112 | -0.6457 | No | ||
| 16 | HIST1H2AC | 3130292 | 12522 | -0.114 | -0.6458 | No | ||
| 17 | HIST1H3G | 5690524 | 12758 | -0.127 | -0.6564 | No | ||
| 18 | UBE2C | 6130017 | 13412 | -0.173 | -0.6887 | No | ||
| 19 | HIST1H1E | 6980706 | 14075 | -0.239 | -0.7205 | No | ||
| 20 | HIST1H2AI | 4540039 | 14206 | -0.258 | -0.7234 | No | ||
| 21 | PHACTR3 | 3850435 5900445 | 14402 | -0.282 | -0.7294 | No | ||
| 22 | PLXNB1 | 6220273 | 14475 | -0.295 | -0.7285 | No | ||
| 23 | HIST1H2BA | 2450059 | 15858 | -0.645 | -0.7925 | No | ||
| 24 | HIST1H2BC | 2570156 6520315 | 16643 | -1.000 | -0.8186 | No | ||
| 25 | HIST1H2BB | 1340035 | 17636 | -1.633 | -0.8457 | Yes | ||
| 26 | HIST1H4A | 1940600 | 17640 | -1.639 | -0.8195 | Yes | ||
| 27 | HIST1H2BG | 5670632 | 17899 | -1.890 | -0.8030 | Yes | ||
| 28 | HIST1H2BM | 3170168 | 18031 | -2.033 | -0.7773 | Yes | ||
| 29 | HIST1H2BJ | 2100551 | 18069 | -2.080 | -0.7458 | Yes | ||
| 30 | HIST1H2BF | 5420402 | 18168 | -2.199 | -0.7157 | Yes | ||
| 31 | HIST1H2BN | 730128 | 18282 | -2.397 | -0.6832 | Yes | ||
| 32 | HIST1H2BL | 6380070 | 18330 | -2.475 | -0.6459 | Yes | ||
| 33 | HIST1H2BH | 2450039 | 18337 | -2.492 | -0.6061 | Yes | ||
| 34 | HIST1H2BK | 6130433 | 18345 | -2.499 | -0.5662 | Yes | ||
| 35 | HIST1H1B | 1410592 | 18366 | -2.565 | -0.5260 | Yes | ||
| 36 | HIST1H2AE | 4920672 | 18378 | -2.595 | -0.4848 | Yes | ||
| 37 | HIST1H2AB | 2680465 | 18444 | -2.796 | -0.4433 | Yes | ||
| 38 | HIST1H1A | 1450131 | 18535 | -3.209 | -0.3965 | Yes | ||
| 39 | HIST1H3H | 2760288 | 18536 | -3.215 | -0.3448 | Yes | ||
| 40 | HIST1H3I | 7100270 | 18564 | -3.416 | -0.2912 | Yes | ||
| 41 | HIST1H3B | 4780092 | 18572 | -3.453 | -0.2360 | Yes | ||
| 42 | HIST2H2BE | 3360184 | 18573 | -3.486 | -0.1799 | Yes | ||
| 43 | HIST1H3E | 840398 | 18577 | -3.512 | -0.1235 | Yes | ||
| 44 | HIST1H3D | 70687 | 18591 | -3.847 | -0.0623 | Yes | ||
| 45 | HIST1H3C | 730204 | 18593 | -3.948 | 0.0012 | Yes |

