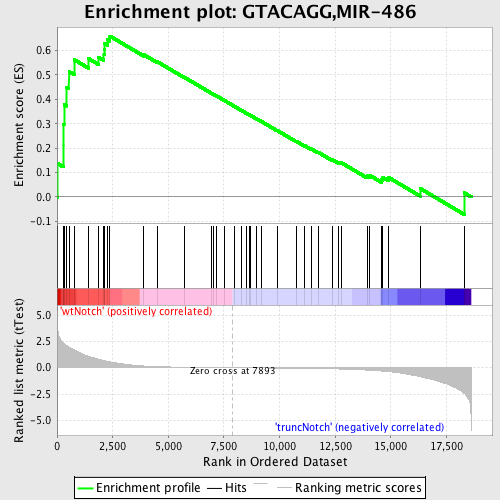
Profile of the Running ES Score & Positions of GeneSet Members on the Rank Ordered List
| Dataset | Set_03_truncNotch_versus_wtNotch.phenotype_truncNotch_versus_wtNotch.cls #wtNotch_versus_truncNotch.phenotype_truncNotch_versus_wtNotch.cls #wtNotch_versus_truncNotch_repos |
| Phenotype | phenotype_truncNotch_versus_wtNotch.cls#wtNotch_versus_truncNotch_repos |
| Upregulated in class | wtNotch |
| GeneSet | GTACAGG,MIR-486 |
| Enrichment Score (ES) | 0.6591194 |
| Normalized Enrichment Score (NES) | 1.7003851 |
| Nominal p-value | 0.0025316456 |
| FDR q-value | 0.013727305 |
| FWER p-Value | 0.123 |
| PROBE | DESCRIPTION (from dataset) | GENE SYMBOL | GENE_TITLE | RANK IN GENE LIST | RANK METRIC SCORE | RUNNING ES | CORE ENRICHMENT | |
|---|---|---|---|---|---|---|---|---|
| 1 | SFRS1 | 2360440 | 15 | 3.775 | 0.1373 | Yes | ||
| 2 | SFRS3 | 770315 4230593 | 276 | 2.375 | 0.2102 | Yes | ||
| 3 | PPP3CB | 6020156 | 277 | 2.375 | 0.2971 | Yes | ||
| 4 | H3F3B | 1410300 | 312 | 2.281 | 0.3788 | Yes | ||
| 5 | STK4 | 2640152 | 427 | 2.091 | 0.4491 | Yes | ||
| 6 | MAP3K7 | 6040068 | 534 | 1.929 | 0.5140 | Yes | ||
| 7 | TOB1 | 4150138 | 775 | 1.671 | 0.5623 | Yes | ||
| 8 | PTEN | 3390064 | 1409 | 1.066 | 0.5672 | Yes | ||
| 9 | NFAT5 | 2510411 5890195 6550152 | 1871 | 0.804 | 0.5718 | Yes | ||
| 10 | SMOC1 | 840039 | 2106 | 0.670 | 0.5837 | Yes | ||
| 11 | SNRPD1 | 4480162 | 2134 | 0.653 | 0.6062 | Yes | ||
| 12 | RBBP6 | 2320129 | 2142 | 0.650 | 0.6296 | Yes | ||
| 13 | CUGBP2 | 6180121 6840139 | 2277 | 0.592 | 0.6440 | Yes | ||
| 14 | FOXO1A | 3120670 | 2373 | 0.553 | 0.6591 | Yes | ||
| 15 | BCORL1 | 1660008 | 3895 | 0.160 | 0.5831 | No | ||
| 16 | SORCS1 | 60411 5890373 | 4496 | 0.102 | 0.5545 | No | ||
| 17 | IRX5 | 2630494 | 5728 | 0.044 | 0.4899 | No | ||
| 18 | SLC12A5 | 1980692 | 6959 | 0.016 | 0.4242 | No | ||
| 19 | PUM2 | 4200441 5910446 | 7013 | 0.015 | 0.4219 | No | ||
| 20 | NCOA6 | 1780333 6450110 | 7155 | 0.012 | 0.4148 | No | ||
| 21 | TBX2 | 1990563 | 7511 | 0.006 | 0.3959 | No | ||
| 22 | SP5 | 3840309 | 7988 | -0.002 | 0.3703 | No | ||
| 23 | CNTNAP4 | 3830364 5340347 | 8276 | -0.006 | 0.3551 | No | ||
| 24 | GAB2 | 1410280 2340520 4280040 | 8529 | -0.010 | 0.3419 | No | ||
| 25 | ARHGAP5 | 2510619 3360035 | 8655 | -0.013 | 0.3356 | No | ||
| 26 | DYNLL1 | 5570113 | 8670 | -0.013 | 0.3353 | No | ||
| 27 | PDZRN3 | 2340131 | 8958 | -0.018 | 0.3205 | No | ||
| 28 | PIK3R1 | 4730671 | 9205 | -0.022 | 0.3081 | No | ||
| 29 | GABRB3 | 4150164 | 9903 | -0.034 | 0.2718 | No | ||
| 30 | UNC5C | 2640056 | 10765 | -0.053 | 0.2274 | No | ||
| 31 | NEUROD6 | 4670731 | 11134 | -0.062 | 0.2098 | No | ||
| 32 | PTPN12 | 2030309 6020725 6130746 6290609 | 11427 | -0.071 | 0.1967 | No | ||
| 33 | COPS7B | 2970484 4280022 | 11727 | -0.080 | 0.1835 | No | ||
| 34 | DCC | 6450438 | 12373 | -0.107 | 0.1527 | No | ||
| 35 | MARK1 | 450484 | 12657 | -0.121 | 0.1419 | No | ||
| 36 | ELAVL2 | 360181 | 12761 | -0.127 | 0.1410 | No | ||
| 37 | ST5 | 3780204 | 13933 | -0.224 | 0.0862 | No | ||
| 38 | SRF | 70139 2320039 | 14038 | -0.235 | 0.0892 | No | ||
| 39 | AFF3 | 3870102 | 14584 | -0.315 | 0.0714 | No | ||
| 40 | ARMC8 | 520408 940132 4060368 4210102 | 14644 | -0.325 | 0.0801 | No | ||
| 41 | FGF13 | 630575 1570440 5360121 | 14902 | -0.371 | 0.0798 | No | ||
| 42 | PIM1 | 630047 | 16318 | -0.856 | 0.0350 | No | ||
| 43 | DOCK3 | 3290273 3360497 2850068 | 18301 | -2.424 | 0.0170 | No |

