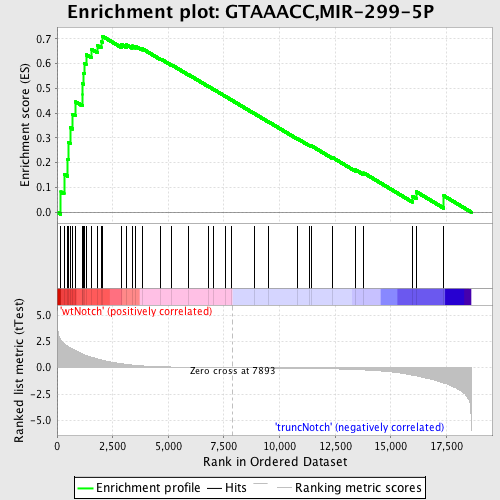
Profile of the Running ES Score & Positions of GeneSet Members on the Rank Ordered List
| Dataset | Set_03_truncNotch_versus_wtNotch.phenotype_truncNotch_versus_wtNotch.cls #wtNotch_versus_truncNotch.phenotype_truncNotch_versus_wtNotch.cls #wtNotch_versus_truncNotch_repos |
| Phenotype | phenotype_truncNotch_versus_wtNotch.cls#wtNotch_versus_truncNotch_repos |
| Upregulated in class | wtNotch |
| GeneSet | GTAAACC,MIR-299-5P |
| Enrichment Score (ES) | 0.71089286 |
| Normalized Enrichment Score (NES) | 1.8008596 |
| Nominal p-value | 0.0 |
| FDR q-value | 0.005086855 |
| FWER p-Value | 0.023 |
| PROBE | DESCRIPTION (from dataset) | GENE SYMBOL | GENE_TITLE | RANK IN GENE LIST | RANK METRIC SCORE | RUNNING ES | CORE ENRICHMENT | |
|---|---|---|---|---|---|---|---|---|
| 1 | CTCF | 5340017 | 172 | 2.618 | 0.0817 | Yes | ||
| 2 | H3F3B | 1410300 | 312 | 2.281 | 0.1535 | Yes | ||
| 3 | ETF1 | 6770075 | 480 | 2.016 | 0.2146 | Yes | ||
| 4 | PPP2R5A | 1990497 | 518 | 1.955 | 0.2806 | Yes | ||
| 5 | RAP2C | 1690132 | 588 | 1.868 | 0.3418 | Yes | ||
| 6 | ZFX | 5900400 | 704 | 1.744 | 0.3962 | Yes | ||
| 7 | MECP2 | 1940450 | 835 | 1.615 | 0.4453 | Yes | ||
| 8 | GOLGA1 | 5860471 | 1138 | 1.294 | 0.4741 | Yes | ||
| 9 | SOX4 | 2260091 | 1140 | 1.291 | 0.5189 | Yes | ||
| 10 | ABCD3 | 7040341 | 1188 | 1.253 | 0.5599 | Yes | ||
| 11 | SFRS7 | 2760408 | 1222 | 1.224 | 0.6006 | Yes | ||
| 12 | HSPA2 | 6420592 | 1304 | 1.149 | 0.6362 | Yes | ||
| 13 | MAT2A | 4070026 4730079 6020280 | 1555 | 0.995 | 0.6573 | Yes | ||
| 14 | TSPAN2 | 3940161 | 1823 | 0.830 | 0.6718 | Yes | ||
| 15 | MAFG | 4120440 | 1978 | 0.739 | 0.6892 | Yes | ||
| 16 | PURB | 5360138 | 2029 | 0.701 | 0.7109 | Yes | ||
| 17 | INPP5A | 5910195 | 2903 | 0.372 | 0.6768 | No | ||
| 18 | PHF12 | 870400 3130687 | 3125 | 0.306 | 0.6756 | No | ||
| 19 | CALU | 2680403 3520056 4610348 5720176 6130121 | 3370 | 0.251 | 0.6712 | No | ||
| 20 | CNOT3 | 130519 4480292 1990609 | 3530 | 0.217 | 0.6702 | No | ||
| 21 | CS | 5080600 | 3819 | 0.172 | 0.6606 | No | ||
| 22 | RSBN1 | 7000487 | 4665 | 0.091 | 0.6183 | No | ||
| 23 | MYF6 | 2690576 | 5153 | 0.066 | 0.5944 | No | ||
| 24 | CAB39 | 5720471 | 5926 | 0.039 | 0.5542 | No | ||
| 25 | MAMDC1 | 3710129 4480075 | 6822 | 0.018 | 0.5067 | No | ||
| 26 | PUM2 | 4200441 5910446 | 7013 | 0.015 | 0.4970 | No | ||
| 27 | ATG5 | 6200433 5360324 | 7584 | 0.005 | 0.4665 | No | ||
| 28 | DLX2 | 2320438 4200673 | 7846 | 0.001 | 0.4525 | No | ||
| 29 | TEAD1 | 2470551 | 8866 | -0.016 | 0.3982 | No | ||
| 30 | TIPARP | 50397 | 9523 | -0.027 | 0.3638 | No | ||
| 31 | ROBO1 | 3710398 | 10817 | -0.054 | 0.2961 | No | ||
| 32 | ABR | 610079 1170609 3610195 5670050 | 11331 | -0.068 | 0.2708 | No | ||
| 33 | MAP3K8 | 2940286 | 11413 | -0.070 | 0.2689 | No | ||
| 34 | TNPO1 | 730092 2260735 | 12387 | -0.107 | 0.2203 | No | ||
| 35 | UBE2J2 | 4850019 5420717 | 13404 | -0.172 | 0.1716 | No | ||
| 36 | TCEAL8 | 4210408 | 13785 | -0.209 | 0.1584 | No | ||
| 37 | SGK | 1400131 2480056 | 15969 | -0.698 | 0.0651 | No | ||
| 38 | CPEB2 | 4760338 | 16145 | -0.773 | 0.0826 | No | ||
| 39 | IPO13 | 3870088 | 17382 | -1.450 | 0.0664 | No |

