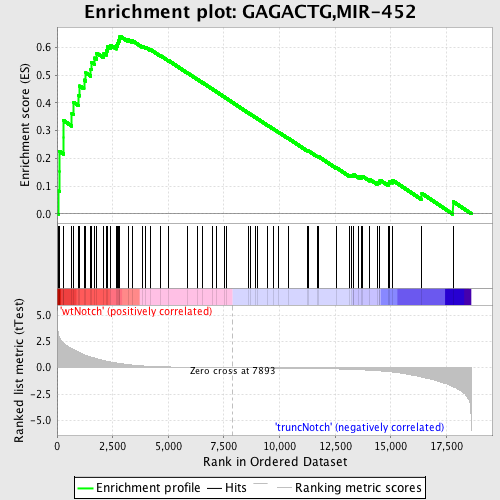
Profile of the Running ES Score & Positions of GeneSet Members on the Rank Ordered List
| Dataset | Set_03_truncNotch_versus_wtNotch.phenotype_truncNotch_versus_wtNotch.cls #wtNotch_versus_truncNotch.phenotype_truncNotch_versus_wtNotch.cls #wtNotch_versus_truncNotch_repos |
| Phenotype | phenotype_truncNotch_versus_wtNotch.cls#wtNotch_versus_truncNotch_repos |
| Upregulated in class | wtNotch |
| GeneSet | GAGACTG,MIR-452 |
| Enrichment Score (ES) | 0.6411663 |
| Normalized Enrichment Score (NES) | 1.7860342 |
| Nominal p-value | 0.0 |
| FDR q-value | 0.005257908 |
| FWER p-Value | 0.028 |
| PROBE | DESCRIPTION (from dataset) | GENE SYMBOL | GENE_TITLE | RANK IN GENE LIST | RANK METRIC SCORE | RUNNING ES | CORE ENRICHMENT | |
|---|---|---|---|---|---|---|---|---|
| 1 | PPP2CA | 3990113 | 47 | 3.290 | 0.0823 | Yes | ||
| 2 | OGT | 2360131 4610333 | 109 | 2.829 | 0.1520 | Yes | ||
| 3 | RHOT1 | 6760692 | 112 | 2.826 | 0.2248 | Yes | ||
| 4 | ADIPOR2 | 1510035 | 291 | 2.348 | 0.2758 | Yes | ||
| 5 | MAPK6 | 6760520 | 292 | 2.346 | 0.3363 | Yes | ||
| 6 | RAB35 | 630056 | 663 | 1.788 | 0.3625 | Yes | ||
| 7 | GTF2E1 | 4070014 | 749 | 1.700 | 0.4018 | Yes | ||
| 8 | PAIP2 | 4210441 | 973 | 1.457 | 0.4273 | Yes | ||
| 9 | CDC42EP3 | 2480138 | 1018 | 1.409 | 0.4613 | Yes | ||
| 10 | BCAS3 | 4050647 | 1209 | 1.234 | 0.4829 | Yes | ||
| 11 | SP1 | 6590017 | 1291 | 1.160 | 0.5085 | Yes | ||
| 12 | RORC | 1740121 | 1514 | 1.006 | 0.5224 | Yes | ||
| 13 | CNOT7 | 2450338 5720397 | 1537 | 1.000 | 0.5470 | Yes | ||
| 14 | TCF4 | 520021 | 1693 | 0.915 | 0.5623 | Yes | ||
| 15 | LDB1 | 5270601 | 1782 | 0.855 | 0.5796 | Yes | ||
| 16 | TCF20 | 1190338 1240520 4070594 4810440 | 2101 | 0.671 | 0.5798 | Yes | ||
| 17 | TCF12 | 3610324 7000156 | 2233 | 0.608 | 0.5884 | Yes | ||
| 18 | ZDHHC5 | 1690711 | 2257 | 0.598 | 0.6026 | Yes | ||
| 19 | PPP1R12A | 4070066 4590162 | 2404 | 0.543 | 0.6087 | Yes | ||
| 20 | MOBKL2B | 940128 | 2667 | 0.452 | 0.6063 | Yes | ||
| 21 | P4HA1 | 2630692 | 2721 | 0.434 | 0.6146 | Yes | ||
| 22 | DYRK1A | 3190181 | 2750 | 0.423 | 0.6240 | Yes | ||
| 23 | RAB8B | 510692 1980017 3130136 4570739 | 2794 | 0.409 | 0.6323 | Yes | ||
| 24 | EN1 | 5360168 7050025 | 2821 | 0.400 | 0.6412 | Yes | ||
| 25 | SLC6A9 | 2470520 | 3203 | 0.287 | 0.6280 | No | ||
| 26 | CALU | 2680403 3520056 4610348 5720176 6130121 | 3370 | 0.251 | 0.6256 | No | ||
| 27 | TNRC15 | 6760746 | 3848 | 0.167 | 0.6042 | No | ||
| 28 | PRRX1 | 4120193 4480390 | 3993 | 0.149 | 0.6002 | No | ||
| 29 | HIP2 | 2810095 3990369 4120301 | 4211 | 0.126 | 0.5918 | No | ||
| 30 | RSBN1 | 7000487 | 4665 | 0.091 | 0.5697 | No | ||
| 31 | PLA2G4A | 6380364 | 5018 | 0.072 | 0.5526 | No | ||
| 32 | DPP10 | 4730746 | 5871 | 0.040 | 0.5077 | No | ||
| 33 | GPR126 | 6650204 | 6330 | 0.029 | 0.4838 | No | ||
| 34 | NPEPPS | 2630731 | 6555 | 0.024 | 0.4723 | No | ||
| 35 | LZTS1 | 4150088 | 6965 | 0.016 | 0.4507 | No | ||
| 36 | TAF4 | 1450170 | 7157 | 0.012 | 0.4407 | No | ||
| 37 | SLC25A27 | 6200707 6940019 | 7520 | 0.006 | 0.4213 | No | ||
| 38 | PRICKLE2 | 780408 | 7606 | 0.005 | 0.4169 | No | ||
| 39 | ZIC1 | 670113 | 8581 | -0.011 | 0.3647 | No | ||
| 40 | DYNLL1 | 5570113 | 8670 | -0.013 | 0.3602 | No | ||
| 41 | CILP | 4590037 | 8920 | -0.017 | 0.3473 | No | ||
| 42 | EPHB3 | 6650341 | 9021 | -0.019 | 0.3423 | No | ||
| 43 | ACVR2A | 6110647 | 9468 | -0.026 | 0.3190 | No | ||
| 44 | ABCC5 | 2100600 5050692 | 9732 | -0.031 | 0.3056 | No | ||
| 45 | BCL2L2 | 2760692 6770739 | 9946 | -0.035 | 0.2950 | No | ||
| 46 | MEIS1 | 1400575 | 10393 | -0.044 | 0.2721 | No | ||
| 47 | PPM2C | 3360209 | 11237 | -0.065 | 0.2283 | No | ||
| 48 | FLRT3 | 70685 2760497 6040519 | 11294 | -0.067 | 0.2271 | No | ||
| 49 | CBX1 | 5080408 1980239 | 11701 | -0.079 | 0.2072 | No | ||
| 50 | EEF2 | 1050369 4670035 5890598 | 11753 | -0.081 | 0.2065 | No | ||
| 51 | NXPH1 | 3870546 | 12561 | -0.116 | 0.1660 | No | ||
| 52 | GGA3 | 940082 2480167 | 13128 | -0.151 | 0.1394 | No | ||
| 53 | HOXC8 | 6220050 | 13209 | -0.157 | 0.1392 | No | ||
| 54 | CUGBP1 | 450292 510022 7050176 7050215 | 13322 | -0.166 | 0.1374 | No | ||
| 55 | SYNCRIP | 1690195 3140113 4670279 | 13338 | -0.167 | 0.1409 | No | ||
| 56 | MTMR4 | 4540524 | 13560 | -0.186 | 0.1338 | No | ||
| 57 | CTBP1 | 3780315 | 13666 | -0.196 | 0.1332 | No | ||
| 58 | ITPKA | 6220075 | 13742 | -0.204 | 0.1344 | No | ||
| 59 | PPM1G | 610725 | 14046 | -0.236 | 0.1242 | No | ||
| 60 | SH3GLB1 | 4590079 5670187 | 14385 | -0.279 | 0.1131 | No | ||
| 61 | PLXNB1 | 6220273 | 14475 | -0.295 | 0.1159 | No | ||
| 62 | LPHN1 | 1400113 3130301 | 14510 | -0.301 | 0.1219 | No | ||
| 63 | DCAMKL1 | 540095 2690092 | 14896 | -0.369 | 0.1107 | No | ||
| 64 | AXIN2 | 3850131 | 14950 | -0.383 | 0.1177 | No | ||
| 65 | EIF4E | 1580403 70133 6380215 | 15076 | -0.410 | 0.1215 | No | ||
| 66 | TLN1 | 6590411 | 16395 | -0.893 | 0.0735 | No | ||
| 67 | RBM14 | 5340731 5690315 | 17794 | -1.791 | 0.0443 | No |

