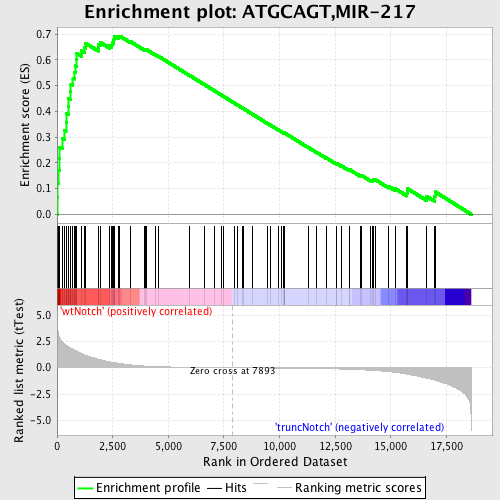
Profile of the Running ES Score & Positions of GeneSet Members on the Rank Ordered List
| Dataset | Set_03_truncNotch_versus_wtNotch.phenotype_truncNotch_versus_wtNotch.cls #wtNotch_versus_truncNotch.phenotype_truncNotch_versus_wtNotch.cls #wtNotch_versus_truncNotch_repos |
| Phenotype | phenotype_truncNotch_versus_wtNotch.cls#wtNotch_versus_truncNotch_repos |
| Upregulated in class | wtNotch |
| GeneSet | ATGCAGT,MIR-217 |
| Enrichment Score (ES) | 0.69235617 |
| Normalized Enrichment Score (NES) | 1.9781259 |
| Nominal p-value | 0.0 |
| FDR q-value | 6.3526566E-4 |
| FWER p-Value | 0.0010 |
| PROBE | DESCRIPTION (from dataset) | GENE SYMBOL | GENE_TITLE | RANK IN GENE LIST | RANK METRIC SCORE | RUNNING ES | CORE ENRICHMENT | |
|---|---|---|---|---|---|---|---|---|
| 1 | SLC31A1 | 4590161 6940154 | 10 | 4.075 | 0.0660 | Yes | ||
| 2 | APPBP2 | 5130215 | 37 | 3.469 | 0.1212 | Yes | ||
| 3 | PPM1D | 1690193 | 62 | 3.098 | 0.1705 | Yes | ||
| 4 | NDEL1 | 2370465 | 94 | 2.900 | 0.2162 | Yes | ||
| 5 | OGT | 2360131 4610333 | 109 | 2.829 | 0.2616 | Yes | ||
| 6 | APRIN | 2810050 | 224 | 2.494 | 0.2961 | Yes | ||
| 7 | UBL3 | 6450458 | 327 | 2.259 | 0.3275 | Yes | ||
| 8 | MTPN | 3940167 | 400 | 2.138 | 0.3585 | Yes | ||
| 9 | IVNS1ABP | 4760601 6520113 | 411 | 2.117 | 0.3925 | Yes | ||
| 10 | MSN | 4060044 | 514 | 1.972 | 0.4192 | Yes | ||
| 11 | PCNA | 940754 | 526 | 1.941 | 0.4503 | Yes | ||
| 12 | RAP2C | 1690132 | 588 | 1.868 | 0.4775 | Yes | ||
| 13 | KRAS | 2060170 | 621 | 1.838 | 0.5058 | Yes | ||
| 14 | TLK2 | 1170161 | 713 | 1.733 | 0.5292 | Yes | ||
| 15 | MYEF2 | 6860484 | 779 | 1.669 | 0.5529 | Yes | ||
| 16 | ZFYVE20 | 6420400 | 828 | 1.620 | 0.5768 | Yes | ||
| 17 | YWHAG | 3780341 | 868 | 1.581 | 0.6005 | Yes | ||
| 18 | ATP1B1 | 3130594 | 875 | 1.572 | 0.6258 | Yes | ||
| 19 | ATP6V1A | 6590242 | 1103 | 1.330 | 0.6353 | Yes | ||
| 20 | SIRT1 | 1190731 | 1245 | 1.201 | 0.6473 | Yes | ||
| 21 | KCTD9 | 780577 | 1275 | 1.180 | 0.6650 | Yes | ||
| 22 | RTF1 | 2100735 | 1843 | 0.818 | 0.6478 | Yes | ||
| 23 | YAF2 | 940053 | 1855 | 0.810 | 0.6604 | Yes | ||
| 24 | DYNC1LI2 | 50338 | 1938 | 0.766 | 0.6685 | Yes | ||
| 25 | EHMT1 | 5290433 5910086 6620112 6980014 | 2361 | 0.558 | 0.6548 | Yes | ||
| 26 | FN1 | 1170601 2970647 6220288 6940037 | 2465 | 0.517 | 0.6577 | Yes | ||
| 27 | SLC39A10 | 4150347 | 2469 | 0.516 | 0.6660 | Yes | ||
| 28 | MAPK1 | 3190193 6200253 | 2520 | 0.498 | 0.6714 | Yes | ||
| 29 | STX1A | 3060273 | 2552 | 0.487 | 0.6777 | Yes | ||
| 30 | STAG2 | 4540132 | 2560 | 0.485 | 0.6852 | Yes | ||
| 31 | JOSD3 | 1110543 | 2581 | 0.478 | 0.6919 | Yes | ||
| 32 | DYRK1A | 3190181 | 2750 | 0.423 | 0.6898 | Yes | ||
| 33 | HIVEP3 | 3990551 | 2824 | 0.398 | 0.6924 | Yes | ||
| 34 | PSMF1 | 5340056 | 3318 | 0.262 | 0.6700 | No | ||
| 35 | SLITRK3 | 5910041 | 3918 | 0.157 | 0.6403 | No | ||
| 36 | EZH2 | 6130605 6380524 | 3983 | 0.150 | 0.6393 | No | ||
| 37 | ATP11C | 770672 7040129 | 4001 | 0.148 | 0.6408 | No | ||
| 38 | ELOVL4 | 5220333 | 4420 | 0.108 | 0.6200 | No | ||
| 39 | AKAP2 | 5550347 | 4542 | 0.099 | 0.6151 | No | ||
| 40 | SOX11 | 610279 | 5948 | 0.038 | 0.5399 | No | ||
| 41 | GRIK2 | 4610164 | 6609 | 0.023 | 0.5047 | No | ||
| 42 | GDI2 | 2370068 | 7070 | 0.014 | 0.4801 | No | ||
| 43 | DACH1 | 2450593 5700592 | 7395 | 0.008 | 0.4628 | No | ||
| 44 | FBXW11 | 6450632 | 7458 | 0.007 | 0.4595 | No | ||
| 45 | ADAMTS5 | 5890592 | 7971 | -0.001 | 0.4319 | No | ||
| 46 | DMRT2 | 2630068 | 8085 | -0.003 | 0.4259 | No | ||
| 47 | RIN2 | 2450184 | 8323 | -0.007 | 0.4132 | No | ||
| 48 | ZCCHC2 | 460592 | 8368 | -0.008 | 0.4110 | No | ||
| 49 | TMSB4X | 6620114 | 8778 | -0.014 | 0.3891 | No | ||
| 50 | ACVR2A | 6110647 | 9468 | -0.026 | 0.3524 | No | ||
| 51 | NFIA | 2760129 5860278 | 9571 | -0.028 | 0.3474 | No | ||
| 52 | DLGAP2 | 1090348 6840154 | 9951 | -0.035 | 0.3275 | No | ||
| 53 | BAI3 | 940692 | 10076 | -0.038 | 0.3214 | No | ||
| 54 | MAMDC2 | 430471 | 10181 | -0.040 | 0.3164 | No | ||
| 55 | GPM6A | 1660044 2750152 | 10198 | -0.040 | 0.3162 | No | ||
| 56 | TBC1D15 | 870673 | 10205 | -0.040 | 0.3166 | No | ||
| 57 | ST18 | 5720537 | 10237 | -0.041 | 0.3156 | No | ||
| 58 | CAPN3 | 1980451 6940047 | 11291 | -0.067 | 0.2598 | No | ||
| 59 | BCL11A | 6860369 | 11650 | -0.077 | 0.2418 | No | ||
| 60 | CUL5 | 450142 | 12089 | -0.094 | 0.2197 | No | ||
| 61 | KLF12 | 1660095 4810288 5340546 6520286 | 12544 | -0.115 | 0.1971 | No | ||
| 62 | NEUROD1 | 3060619 | 12563 | -0.117 | 0.1980 | No | ||
| 63 | STRBP | 4210594 5360239 | 12766 | -0.127 | 0.1892 | No | ||
| 64 | STAT5B | 6200026 | 13123 | -0.151 | 0.1725 | No | ||
| 65 | SEPT4 | 1580593 | 13127 | -0.151 | 0.1748 | No | ||
| 66 | SENP5 | 4560537 6760465 | 13644 | -0.194 | 0.1501 | No | ||
| 67 | TACC2 | 580092 1400364 2650497 2690315 5360338 | 13671 | -0.197 | 0.1519 | No | ||
| 68 | KCNA3 | 510059 | 14089 | -0.240 | 0.1333 | No | ||
| 69 | PAQR3 | 2480064 | 14182 | -0.254 | 0.1325 | No | ||
| 70 | HNRPUL1 | 2120008 4920408 5570180 6370609 6770403 | 14213 | -0.258 | 0.1351 | No | ||
| 71 | A2BP1 | 2370390 4590593 5550014 | 14302 | -0.269 | 0.1348 | No | ||
| 72 | STX6 | 4850750 6770278 | 14905 | -0.371 | 0.1084 | No | ||
| 73 | NR4A2 | 60273 | 15192 | -0.433 | 0.1000 | No | ||
| 74 | FBN2 | 50435 | 15726 | -0.603 | 0.0811 | No | ||
| 75 | CHN2 | 870528 | 15731 | -0.604 | 0.0907 | No | ||
| 76 | EIF4A2 | 1170494 1740711 2850504 | 15750 | -0.611 | 0.0997 | No | ||
| 77 | SLC38A2 | 1470242 3800026 | 16616 | -0.995 | 0.0693 | No | ||
| 78 | HNRPA2B1 | 1240619 6200161 6200494 6980408 | 16949 | -1.163 | 0.0704 | No | ||
| 79 | POLG | 780465 | 16998 | -1.193 | 0.0873 | No |

