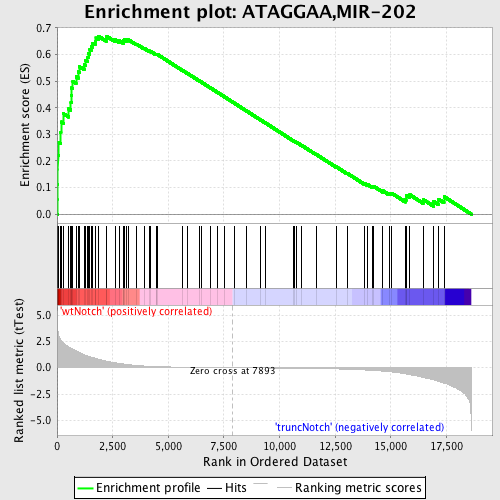
Profile of the Running ES Score & Positions of GeneSet Members on the Rank Ordered List
| Dataset | Set_03_truncNotch_versus_wtNotch.phenotype_truncNotch_versus_wtNotch.cls #wtNotch_versus_truncNotch.phenotype_truncNotch_versus_wtNotch.cls #wtNotch_versus_truncNotch_repos |
| Phenotype | phenotype_truncNotch_versus_wtNotch.cls#wtNotch_versus_truncNotch_repos |
| Upregulated in class | wtNotch |
| GeneSet | ATAGGAA,MIR-202 |
| Enrichment Score (ES) | 0.66934776 |
| Normalized Enrichment Score (NES) | 1.9294978 |
| Nominal p-value | 0.0 |
| FDR q-value | 3.8115942E-4 |
| FWER p-Value | 0.0010 |
| PROBE | DESCRIPTION (from dataset) | GENE SYMBOL | GENE_TITLE | RANK IN GENE LIST | RANK METRIC SCORE | RUNNING ES | CORE ENRICHMENT | |
|---|---|---|---|---|---|---|---|---|
| 1 | MARCKS | 7040450 | 21 | 3.674 | 0.0568 | Yes | ||
| 2 | LBR | 4540671 | 26 | 3.582 | 0.1131 | Yes | ||
| 3 | APPBP2 | 5130215 | 37 | 3.469 | 0.1673 | Yes | ||
| 4 | ELF1 | 4780450 | 39 | 3.453 | 0.2217 | Yes | ||
| 5 | SFPQ | 4760110 | 60 | 3.132 | 0.2701 | Yes | ||
| 6 | ANP32E | 6510706 | 166 | 2.630 | 0.3059 | Yes | ||
| 7 | BAG4 | 2260070 | 175 | 2.614 | 0.3467 | Yes | ||
| 8 | MAPK6 | 6760520 | 292 | 2.346 | 0.3775 | Yes | ||
| 9 | RASA1 | 1240315 | 523 | 1.945 | 0.3958 | Yes | ||
| 10 | KRAS | 2060170 | 621 | 1.838 | 0.4195 | Yes | ||
| 11 | RNF11 | 3990068 5080458 | 643 | 1.812 | 0.4470 | Yes | ||
| 12 | SENP1 | 6100537 | 656 | 1.792 | 0.4746 | Yes | ||
| 13 | CNN3 | 6110020 | 709 | 1.739 | 0.4992 | Yes | ||
| 14 | IQGAP1 | 6660494 | 854 | 1.591 | 0.5166 | Yes | ||
| 15 | DDX3X | 2190020 | 949 | 1.484 | 0.5349 | Yes | ||
| 16 | TTC13 | 3520750 | 1010 | 1.416 | 0.5540 | Yes | ||
| 17 | MIB1 | 3800537 | 1217 | 1.228 | 0.5623 | Yes | ||
| 18 | STAT3 | 460040 3710341 | 1278 | 1.177 | 0.5776 | Yes | ||
| 19 | CREBBP | 5690035 7040050 | 1378 | 1.091 | 0.5895 | Yes | ||
| 20 | PTEN | 3390064 | 1409 | 1.066 | 0.6047 | Yes | ||
| 21 | EI24 | 3120433 | 1471 | 1.027 | 0.6176 | Yes | ||
| 22 | BTG1 | 4200735 6040131 6200133 | 1533 | 1.000 | 0.6301 | Yes | ||
| 23 | CD28 | 1400739 4210093 | 1578 | 0.983 | 0.6432 | Yes | ||
| 24 | RPS6KA3 | 1980707 | 1711 | 0.902 | 0.6504 | Yes | ||
| 25 | TRIM33 | 580619 2230280 3990433 6200747 | 1746 | 0.879 | 0.6624 | Yes | ||
| 26 | YAF2 | 940053 | 1855 | 0.810 | 0.6693 | Yes | ||
| 27 | ERBB2IP | 580253 1090672 | 2205 | 0.621 | 0.6603 | No | ||
| 28 | TCF12 | 3610324 7000156 | 2233 | 0.608 | 0.6685 | No | ||
| 29 | NARG1 | 5910563 6350095 | 2607 | 0.469 | 0.6558 | No | ||
| 30 | PPP5C | 3130047 | 2795 | 0.409 | 0.6521 | No | ||
| 31 | SNX16 | 870446 | 2982 | 0.347 | 0.6476 | No | ||
| 32 | USP8 | 2640347 3840451 6100672 | 2993 | 0.344 | 0.6525 | No | ||
| 33 | RAB22A | 110500 3830707 | 3032 | 0.331 | 0.6556 | No | ||
| 34 | BICD2 | 1090411 | 3127 | 0.306 | 0.6554 | No | ||
| 35 | CTBP2 | 430309 3710079 | 3211 | 0.285 | 0.6554 | No | ||
| 36 | CBL | 6380068 | 3569 | 0.209 | 0.6394 | No | ||
| 37 | TGFBR2 | 1780711 1980537 6550398 | 3914 | 0.157 | 0.6234 | No | ||
| 38 | THRAP2 | 4920600 | 4133 | 0.134 | 0.6137 | No | ||
| 39 | HIP2 | 2810095 3990369 4120301 | 4211 | 0.126 | 0.6115 | No | ||
| 40 | PCGF2 | 6370347 | 4445 | 0.106 | 0.6007 | No | ||
| 41 | USP15 | 610592 3520504 | 4468 | 0.104 | 0.6011 | No | ||
| 42 | SORCS1 | 60411 5890373 | 4496 | 0.102 | 0.6013 | No | ||
| 43 | NR2F2 | 3170609 3310577 | 5628 | 0.048 | 0.5410 | No | ||
| 44 | RAD52 | 110093 | 5862 | 0.041 | 0.5291 | No | ||
| 45 | SNAP91 | 3170056 5690520 | 6406 | 0.027 | 0.5003 | No | ||
| 46 | KIAA1715 | 1190551 | 6473 | 0.026 | 0.4971 | No | ||
| 47 | FAM60A | 3940092 | 6912 | 0.017 | 0.4737 | No | ||
| 48 | DNAJC10 | 2350601 | 7186 | 0.012 | 0.4592 | No | ||
| 49 | KHDRBS2 | 3520717 | 7537 | 0.006 | 0.4404 | No | ||
| 50 | SPRED1 | 6940706 | 7965 | -0.001 | 0.4174 | No | ||
| 51 | ESR1 | 4060372 5860193 | 8512 | -0.010 | 0.3881 | No | ||
| 52 | ACSL3 | 3140195 | 9151 | -0.021 | 0.3540 | No | ||
| 53 | RNF121 | 110079 1580279 | 9344 | -0.024 | 0.3441 | No | ||
| 54 | HLF | 2370113 | 10626 | -0.050 | 0.2758 | No | ||
| 55 | RKHD3 | 6180471 | 10681 | -0.051 | 0.2737 | No | ||
| 56 | ENAH | 1690292 5700300 | 10747 | -0.052 | 0.2710 | No | ||
| 57 | CPEB3 | 3940164 | 10968 | -0.058 | 0.2600 | No | ||
| 58 | BCL11A | 6860369 | 11650 | -0.077 | 0.2245 | No | ||
| 59 | KLF12 | 1660095 4810288 5340546 6520286 | 12544 | -0.115 | 0.1782 | No | ||
| 60 | ROBO2 | 450136 | 13032 | -0.144 | 0.1542 | No | ||
| 61 | HOXB2 | 6450592 | 13804 | -0.210 | 0.1159 | No | ||
| 62 | ACVR1 | 6840671 | 13964 | -0.228 | 0.1109 | No | ||
| 63 | LUZP1 | 940075 4280458 6180070 | 14179 | -0.253 | 0.1034 | No | ||
| 64 | GRIA3 | 2900164 6130278 6860154 | 14236 | -0.262 | 0.1045 | No | ||
| 65 | DDEF1 | 1170411 4070465 | 14642 | -0.325 | 0.0878 | No | ||
| 66 | ARSB | 3190093 5360491 | 14931 | -0.377 | 0.0782 | No | ||
| 67 | ATXN1 | 5550156 | 15042 | -0.402 | 0.0786 | No | ||
| 68 | BCL2 | 730132 1570736 2470138 3800044 4810037 5690068 5860504 6650164 | 15654 | -0.579 | 0.0548 | No | ||
| 69 | PPARBP | 4280131 5690022 5860050 | 15688 | -0.591 | 0.0623 | No | ||
| 70 | ZFAND3 | 2760504 | 15690 | -0.591 | 0.0716 | No | ||
| 71 | EAF1 | 5420039 6550619 | 15856 | -0.645 | 0.0729 | No | ||
| 72 | TARDBP | 870390 2350093 | 16452 | -0.917 | 0.0553 | No | ||
| 73 | SSBP2 | 2260725 2900400 4730711 | 16927 | -1.151 | 0.0478 | No | ||
| 74 | NDRG1 | 1340040 | 17132 | -1.276 | 0.0570 | No | ||
| 75 | VANGL2 | 70097 870075 | 17392 | -1.458 | 0.0660 | No |

