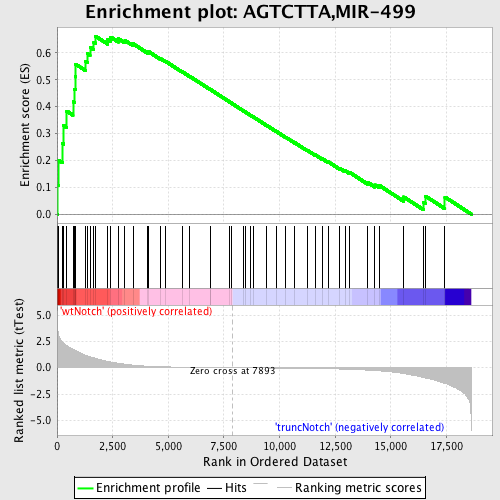
Profile of the Running ES Score & Positions of GeneSet Members on the Rank Ordered List
| Dataset | Set_03_truncNotch_versus_wtNotch.phenotype_truncNotch_versus_wtNotch.cls #wtNotch_versus_truncNotch.phenotype_truncNotch_versus_wtNotch.cls #wtNotch_versus_truncNotch_repos |
| Phenotype | phenotype_truncNotch_versus_wtNotch.cls#wtNotch_versus_truncNotch_repos |
| Upregulated in class | wtNotch |
| GeneSet | AGTCTTA,MIR-499 |
| Enrichment Score (ES) | 0.662167 |
| Normalized Enrichment Score (NES) | 1.7494798 |
| Nominal p-value | 0.0 |
| FDR q-value | 0.008407522 |
| FWER p-Value | 0.058 |
| PROBE | DESCRIPTION (from dataset) | GENE SYMBOL | GENE_TITLE | RANK IN GENE LIST | RANK METRIC SCORE | RUNNING ES | CORE ENRICHMENT | |
|---|---|---|---|---|---|---|---|---|
| 1 | MARCKS | 7040450 | 21 | 3.674 | 0.1071 | Yes | ||
| 2 | TRAM1 | 2340441 6620592 | 51 | 3.221 | 0.2005 | Yes | ||
| 3 | RNF44 | 5910692 | 235 | 2.469 | 0.2634 | Yes | ||
| 4 | MAPK6 | 6760520 | 292 | 2.346 | 0.3295 | Yes | ||
| 5 | DDX1 | 3450047 | 435 | 2.082 | 0.3832 | Yes | ||
| 6 | HNRPC | 1570133 3610131 | 715 | 1.733 | 0.4193 | Yes | ||
| 7 | MYEF2 | 6860484 | 779 | 1.669 | 0.4651 | Yes | ||
| 8 | H2AFZ | 1470168 | 822 | 1.628 | 0.5108 | Yes | ||
| 9 | MECP2 | 1940450 | 835 | 1.615 | 0.5577 | Yes | ||
| 10 | UBE2E1 | 4230064 1090440 | 1269 | 1.186 | 0.5693 | Yes | ||
| 11 | PDCD4 | 3360403 5690110 | 1356 | 1.111 | 0.5975 | Yes | ||
| 12 | DGCR8 | 3450632 | 1481 | 1.022 | 0.6209 | Yes | ||
| 13 | EML4 | 5700373 | 1651 | 0.941 | 0.6395 | Yes | ||
| 14 | RYBP | 60746 | 1721 | 0.894 | 0.6622 | Yes | ||
| 15 | CUGBP2 | 6180121 6840139 | 2277 | 0.592 | 0.6497 | No | ||
| 16 | ROD1 | 2060324 3140332 | 2408 | 0.541 | 0.6586 | No | ||
| 17 | AEBP2 | 2970603 | 2753 | 0.423 | 0.6526 | No | ||
| 18 | EIF2C4 | 2940577 5900563 | 3049 | 0.325 | 0.6463 | No | ||
| 19 | PPP3CA | 4760332 6760092 | 3415 | 0.243 | 0.6338 | No | ||
| 20 | QKI | 5220093 6130044 | 4072 | 0.139 | 0.6025 | No | ||
| 21 | KPNA3 | 7040088 | 4093 | 0.137 | 0.6055 | No | ||
| 22 | RSBN1 | 7000487 | 4665 | 0.091 | 0.5774 | No | ||
| 23 | LRCH2 | 2900162 | 4857 | 0.080 | 0.5695 | No | ||
| 24 | WTAP | 4010176 | 5624 | 0.048 | 0.5296 | No | ||
| 25 | SOX11 | 610279 | 5948 | 0.038 | 0.5134 | No | ||
| 26 | PLAG1 | 1450142 3870139 6520039 | 6905 | 0.017 | 0.4624 | No | ||
| 27 | FAM60A | 3940092 | 6912 | 0.017 | 0.4625 | No | ||
| 28 | ZBTB10 | 4200132 | 7734 | 0.003 | 0.4184 | No | ||
| 29 | ENPP2 | 5860546 | 7831 | 0.001 | 0.4133 | No | ||
| 30 | ADAM10 | 3780156 | 8396 | -0.008 | 0.3831 | No | ||
| 31 | RAB5C | 1990397 | 8476 | -0.009 | 0.3791 | No | ||
| 32 | ESRRG | 4010181 | 8690 | -0.013 | 0.3681 | No | ||
| 33 | MYB | 1660494 5860451 6130706 | 8845 | -0.015 | 0.3602 | No | ||
| 34 | RCN2 | 840324 | 9398 | -0.025 | 0.3312 | No | ||
| 35 | ARHGAP12 | 1050181 | 9856 | -0.033 | 0.3076 | No | ||
| 36 | PTBP2 | 1240398 | 10275 | -0.041 | 0.2863 | No | ||
| 37 | UBN1 | 5900195 | 10688 | -0.051 | 0.2656 | No | ||
| 38 | SOX6 | 2940458 4070601 6840717 | 11254 | -0.066 | 0.2371 | No | ||
| 39 | MLLT7 | 4480707 | 11595 | -0.076 | 0.2210 | No | ||
| 40 | UBE2V2 | 4210484 | 11909 | -0.087 | 0.2067 | No | ||
| 41 | KIF3C | 2360162 2940110 | 12186 | -0.098 | 0.1948 | No | ||
| 42 | VGLL2 | 3940148 7040142 | 12714 | -0.124 | 0.1700 | No | ||
| 43 | TESK2 | 6520524 | 12948 | -0.139 | 0.1616 | No | ||
| 44 | SDC2 | 1980168 | 13129 | -0.151 | 0.1563 | No | ||
| 45 | EDAR | 6220670 | 13960 | -0.227 | 0.1183 | No | ||
| 46 | SOX5 | 2370576 2900167 3190128 5050528 | 14287 | -0.268 | 0.1087 | No | ||
| 47 | UBE2V1 | 2470093 | 14474 | -0.295 | 0.1073 | No | ||
| 48 | CFL2 | 380239 6200368 | 15581 | -0.551 | 0.0640 | No | ||
| 49 | HIC2 | 4010433 | 16466 | -0.923 | 0.0436 | No | ||
| 50 | TOP1 | 770471 4060632 6650324 | 16558 | -0.968 | 0.0672 | No | ||
| 51 | ARID2 | 110647 5390435 | 17432 | -1.479 | 0.0638 | No |

