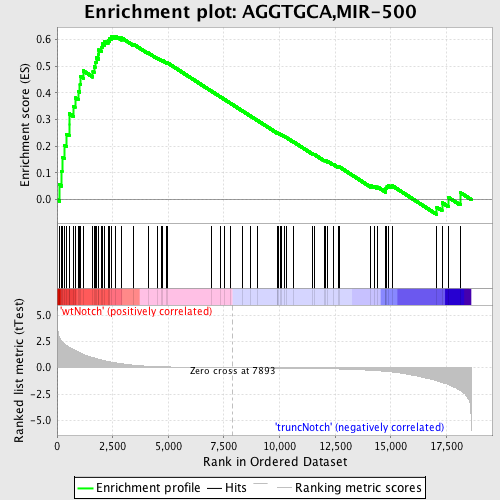
Profile of the Running ES Score & Positions of GeneSet Members on the Rank Ordered List
| Dataset | Set_03_truncNotch_versus_wtNotch.phenotype_truncNotch_versus_wtNotch.cls #wtNotch_versus_truncNotch.phenotype_truncNotch_versus_wtNotch.cls #wtNotch_versus_truncNotch_repos |
| Phenotype | phenotype_truncNotch_versus_wtNotch.cls#wtNotch_versus_truncNotch_repos |
| Upregulated in class | wtNotch |
| GeneSet | AGGTGCA,MIR-500 |
| Enrichment Score (ES) | 0.6127703 |
| Normalized Enrichment Score (NES) | 1.7056806 |
| Nominal p-value | 0.0 |
| FDR q-value | 0.013806342 |
| FWER p-Value | 0.117 |
| PROBE | DESCRIPTION (from dataset) | GENE SYMBOL | GENE_TITLE | RANK IN GENE LIST | RANK METRIC SCORE | RUNNING ES | CORE ENRICHMENT | |
|---|---|---|---|---|---|---|---|---|
| 1 | OGT | 2360131 4610333 | 109 | 2.829 | 0.0560 | Yes | ||
| 2 | DCTN4 | 3390010 5550170 | 206 | 2.527 | 0.1060 | Yes | ||
| 3 | APRIN | 2810050 | 224 | 2.494 | 0.1596 | Yes | ||
| 4 | RAB14 | 6860139 | 320 | 2.272 | 0.2042 | Yes | ||
| 5 | IVNS1ABP | 4760601 6520113 | 411 | 2.117 | 0.2456 | Yes | ||
| 6 | UBE2D3 | 3190452 | 542 | 1.915 | 0.2804 | Yes | ||
| 7 | NCOA1 | 3610438 | 543 | 1.911 | 0.3222 | Yes | ||
| 8 | PPP2R5E | 70671 2120056 | 738 | 1.710 | 0.3492 | Yes | ||
| 9 | PPP4R1 | 5670088 6420402 | 808 | 1.641 | 0.3813 | Yes | ||
| 10 | DDX3X | 2190020 | 949 | 1.484 | 0.4062 | Yes | ||
| 11 | SLC4A7 | 2370056 | 1027 | 1.404 | 0.4327 | Yes | ||
| 12 | TIMM8A | 110279 | 1050 | 1.388 | 0.4619 | Yes | ||
| 13 | KBTBD2 | 2320014 | 1175 | 1.261 | 0.4828 | Yes | ||
| 14 | CUTL1 | 1570113 1770091 1850273 2100286 5340605 | 1610 | 0.971 | 0.4806 | Yes | ||
| 15 | RBMS1 | 6400014 | 1665 | 0.929 | 0.4980 | Yes | ||
| 16 | PPP3CC | 2450139 | 1709 | 0.903 | 0.5154 | Yes | ||
| 17 | SEC24C | 6980707 | 1761 | 0.869 | 0.5317 | Yes | ||
| 18 | CAMK4 | 1690091 | 1862 | 0.806 | 0.5439 | Yes | ||
| 19 | NFAT5 | 2510411 5890195 6550152 | 1871 | 0.804 | 0.5610 | Yes | ||
| 20 | KLF9 | 3840022 | 2009 | 0.722 | 0.5694 | Yes | ||
| 21 | PURB | 5360138 | 2029 | 0.701 | 0.5838 | Yes | ||
| 22 | THAP11 | 6940025 | 2138 | 0.651 | 0.5922 | Yes | ||
| 23 | ABCC4 | 130309 | 2291 | 0.586 | 0.5968 | Yes | ||
| 24 | ING4 | 510632 2340619 2850176 5290706 | 2368 | 0.554 | 0.6048 | Yes | ||
| 25 | CIT | 2370601 | 2435 | 0.528 | 0.6128 | Yes | ||
| 26 | SOCS2 | 4760692 | 2633 | 0.461 | 0.6122 | No | ||
| 27 | CREB1 | 1500717 2230358 3610600 6550601 | 2898 | 0.374 | 0.6062 | No | ||
| 28 | NRF1 | 2650195 | 3453 | 0.233 | 0.5814 | No | ||
| 29 | KPNA3 | 7040088 | 4093 | 0.137 | 0.5500 | No | ||
| 30 | SORCS1 | 60411 5890373 | 4496 | 0.102 | 0.5305 | No | ||
| 31 | RTN4RL1 | 2630368 | 4697 | 0.089 | 0.5217 | No | ||
| 32 | E2F3 | 50162 460180 | 4748 | 0.086 | 0.5209 | No | ||
| 33 | HIPK1 | 110193 | 4934 | 0.076 | 0.5126 | No | ||
| 34 | DDX3Y | 1580278 4200519 | 4968 | 0.075 | 0.5124 | No | ||
| 35 | CACNB1 | 2940427 3710487 | 6937 | 0.016 | 0.4067 | No | ||
| 36 | HSPA14 | 4610487 | 7330 | 0.009 | 0.3857 | No | ||
| 37 | TBX2 | 1990563 | 7511 | 0.006 | 0.3762 | No | ||
| 38 | DRD1 | 430025 | 7810 | 0.001 | 0.3601 | No | ||
| 39 | SPG3A | 2760091 3120170 | 8340 | -0.007 | 0.3318 | No | ||
| 40 | ESRRG | 4010181 | 8690 | -0.013 | 0.3132 | No | ||
| 41 | SHPRH | 3990458 | 9003 | -0.018 | 0.2968 | No | ||
| 42 | BTBD11 | 6650154 | 9886 | -0.034 | 0.2500 | No | ||
| 43 | GABRB3 | 4150164 | 9903 | -0.034 | 0.2499 | No | ||
| 44 | PRKCE | 5700053 | 9955 | -0.035 | 0.2479 | No | ||
| 45 | FIGN | 7000601 | 10027 | -0.037 | 0.2449 | No | ||
| 46 | PHOX2B | 5270075 | 10099 | -0.038 | 0.2419 | No | ||
| 47 | GPM6A | 1660044 2750152 | 10198 | -0.040 | 0.2375 | No | ||
| 48 | LRRTM3 | 4210021 | 10308 | -0.042 | 0.2325 | No | ||
| 49 | HLF | 2370113 | 10626 | -0.050 | 0.2165 | No | ||
| 50 | RAI2 | 6770333 | 11484 | -0.072 | 0.1719 | No | ||
| 51 | TSSK2 | 5220324 | 11560 | -0.075 | 0.1695 | No | ||
| 52 | LBP | 6860019 | 12019 | -0.091 | 0.1468 | No | ||
| 53 | SYT8 | 4280551 | 12047 | -0.092 | 0.1473 | No | ||
| 54 | CHRD | 3140368 | 12172 | -0.097 | 0.1428 | No | ||
| 55 | OSBPL10 | 1980184 | 12401 | -0.108 | 0.1329 | No | ||
| 56 | CELSR3 | 5270731 7100082 | 12635 | -0.121 | 0.1229 | No | ||
| 57 | PLXDC2 | 6400358 | 12688 | -0.123 | 0.1228 | No | ||
| 58 | RAB21 | 5570070 | 14105 | -0.242 | 0.0518 | No | ||
| 59 | SP8 | 4060576 | 14250 | -0.264 | 0.0498 | No | ||
| 60 | RNF38 | 1940746 3140133 3840601 | 14408 | -0.283 | 0.0475 | No | ||
| 61 | MATR3 | 1940170 5340278 | 14770 | -0.346 | 0.0356 | No | ||
| 62 | MYNN | 1980022 4210358 | 14777 | -0.347 | 0.0429 | No | ||
| 63 | POFUT1 | 1570458 | 14826 | -0.354 | 0.0480 | No | ||
| 64 | RNF40 | 3610397 | 14904 | -0.371 | 0.0520 | No | ||
| 65 | FBXW7 | 4210338 7050280 | 15058 | -0.405 | 0.0526 | No | ||
| 66 | HNRPA0 | 2680048 | 17065 | -1.239 | -0.0285 | No | ||
| 67 | NOLA2 | 4060167 | 17304 | -1.388 | -0.0110 | No | ||
| 68 | SLC25A26 | 4210577 | 17588 | -1.593 | 0.0086 | No | ||
| 69 | EGLN2 | 540086 | 18119 | -2.139 | 0.0268 | No |

