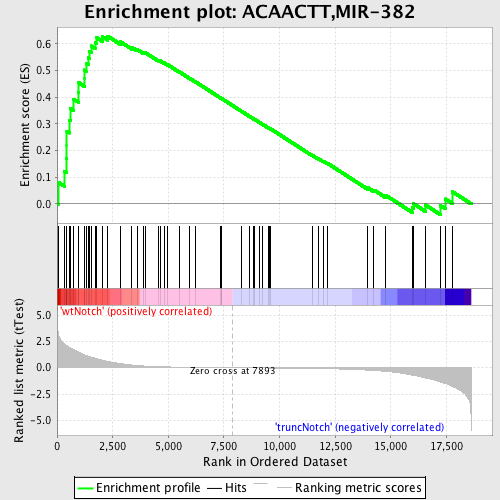
Profile of the Running ES Score & Positions of GeneSet Members on the Rank Ordered List
| Dataset | Set_03_truncNotch_versus_wtNotch.phenotype_truncNotch_versus_wtNotch.cls #wtNotch_versus_truncNotch.phenotype_truncNotch_versus_wtNotch.cls #wtNotch_versus_truncNotch_repos |
| Phenotype | phenotype_truncNotch_versus_wtNotch.cls#wtNotch_versus_truncNotch_repos |
| Upregulated in class | wtNotch |
| GeneSet | ACAACTT,MIR-382 |
| Enrichment Score (ES) | 0.62901443 |
| Normalized Enrichment Score (NES) | 1.7085191 |
| Nominal p-value | 0.0 |
| FDR q-value | 0.015281258 |
| FWER p-Value | 0.115 |
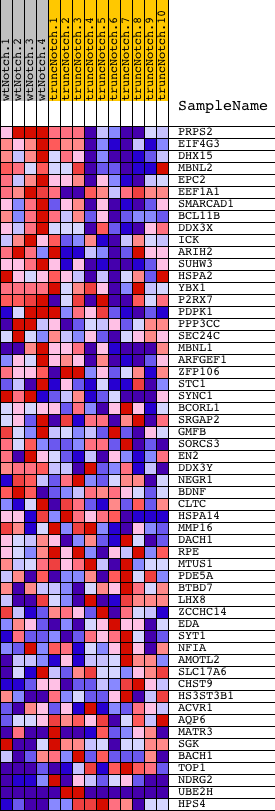
| PROBE | DESCRIPTION (from dataset) | GENE SYMBOL | GENE_TITLE | RANK IN GENE LIST | RANK METRIC SCORE | RUNNING ES | CORE ENRICHMENT | |
|---|---|---|---|---|---|---|---|---|
| 1 | PRPS2 | 3140707 | 44 | 3.352 | 0.0814 | Yes | ||
| 2 | EIF4G3 | 670707 | 335 | 2.239 | 0.1217 | Yes | ||
| 3 | DHX15 | 870632 | 428 | 2.087 | 0.1689 | Yes | ||
| 4 | MBNL2 | 3450707 | 439 | 2.076 | 0.2203 | Yes | ||
| 5 | EPC2 | 2470095 | 441 | 2.073 | 0.2721 | Yes | ||
| 6 | EEF1A1 | 1980193 1990195 4670735 | 559 | 1.897 | 0.3131 | Yes | ||
| 7 | SMARCAD1 | 5390619 | 589 | 1.868 | 0.3583 | Yes | ||
| 8 | BCL11B | 2680673 | 746 | 1.704 | 0.3925 | Yes | ||
| 9 | DDX3X | 2190020 | 949 | 1.484 | 0.4187 | Yes | ||
| 10 | ICK | 1580746 3140021 | 963 | 1.471 | 0.4547 | Yes | ||
| 11 | ARIH2 | 2810025 | 1220 | 1.227 | 0.4716 | Yes | ||
| 12 | SUHW3 | 50400 | 1223 | 1.223 | 0.5021 | Yes | ||
| 13 | HSPA2 | 6420592 | 1304 | 1.149 | 0.5265 | Yes | ||
| 14 | YBX1 | 1340039 4730500 | 1402 | 1.073 | 0.5480 | Yes | ||
| 15 | P2RX7 | 6020048 6380053 6510121 | 1463 | 1.034 | 0.5707 | Yes | ||
| 16 | PDPK1 | 6650168 | 1530 | 1.001 | 0.5921 | Yes | ||
| 17 | PPP3CC | 2450139 | 1709 | 0.903 | 0.6051 | Yes | ||
| 18 | SEC24C | 6980707 | 1761 | 0.869 | 0.6241 | Yes | ||
| 19 | MBNL1 | 2640762 7100048 | 2031 | 0.700 | 0.6271 | Yes | ||
| 20 | ARFGEF1 | 6760494 | 2271 | 0.593 | 0.6290 | Yes | ||
| 21 | ZFP106 | 130292 2370315 3940286 | 2845 | 0.390 | 0.6079 | No | ||
| 22 | STC1 | 360161 | 3361 | 0.253 | 0.5865 | No | ||
| 23 | SYNC1 | 580114 | 3596 | 0.205 | 0.5790 | No | ||
| 24 | BCORL1 | 1660008 | 3895 | 0.160 | 0.5669 | No | ||
| 25 | SRGAP2 | 1050092 1230403 3830066 6130215 | 3953 | 0.152 | 0.5676 | No | ||
| 26 | GMFB | 6590035 | 4548 | 0.099 | 0.5381 | No | ||
| 27 | SORCS3 | 5700309 | 4624 | 0.094 | 0.5364 | No | ||
| 28 | EN2 | 7000368 | 4810 | 0.082 | 0.5285 | No | ||
| 29 | DDX3Y | 1580278 4200519 | 4968 | 0.075 | 0.5219 | No | ||
| 30 | NEGR1 | 1940731 5130170 | 5494 | 0.053 | 0.4949 | No | ||
| 31 | BDNF | 2940128 3520368 | 5956 | 0.038 | 0.4710 | No | ||
| 32 | CLTC | 6590458 | 6200 | 0.032 | 0.4587 | No | ||
| 33 | HSPA14 | 4610487 | 7330 | 0.009 | 0.3981 | No | ||
| 34 | MMP16 | 2680139 | 7379 | 0.009 | 0.3958 | No | ||
| 35 | DACH1 | 2450593 5700592 | 7395 | 0.008 | 0.3952 | No | ||
| 36 | RPE | 940114 | 8296 | -0.006 | 0.3468 | No | ||
| 37 | MTUS1 | 780348 4920609 | 8643 | -0.012 | 0.3285 | No | ||
| 38 | PDE5A | 130072 | 8804 | -0.015 | 0.3202 | No | ||
| 39 | BTBD7 | 730288 | 8864 | -0.016 | 0.3175 | No | ||
| 40 | LHX8 | 5700347 | 9079 | -0.020 | 0.3064 | No | ||
| 41 | ZCCHC14 | 5900288 | 9229 | -0.022 | 0.2989 | No | ||
| 42 | EDA | 6420441 | 9480 | -0.026 | 0.2861 | No | ||
| 43 | SYT1 | 840364 | 9554 | -0.028 | 0.2829 | No | ||
| 44 | NFIA | 2760129 5860278 | 9571 | -0.028 | 0.2827 | No | ||
| 45 | AMOTL2 | 4730082 | 11479 | -0.072 | 0.1818 | No | ||
| 46 | SLC17A6 | 4210576 | 11731 | -0.080 | 0.1703 | No | ||
| 47 | CHST9 | 4560092 | 11963 | -0.089 | 0.1601 | No | ||
| 48 | HS3ST3B1 | 380040 | 12146 | -0.096 | 0.1526 | No | ||
| 49 | ACVR1 | 6840671 | 13964 | -0.228 | 0.0604 | No | ||
| 50 | AQP6 | 510736 1570484 | 14241 | -0.262 | 0.0521 | No | ||
| 51 | MATR3 | 1940170 5340278 | 14770 | -0.346 | 0.0323 | No | ||
| 52 | SGK | 1400131 2480056 | 15969 | -0.698 | -0.0148 | No | ||
| 53 | BACH1 | 290195 | 16029 | -0.727 | 0.0002 | No | ||
| 54 | TOP1 | 770471 4060632 6650324 | 16558 | -0.968 | -0.0040 | No | ||
| 55 | NDRG2 | 450403 | 17220 | -1.340 | -0.0062 | No | ||
| 56 | UBE2H | 1980142 2970079 | 17455 | -1.491 | 0.0185 | No | ||
| 57 | HPS4 | 6940110 | 17772 | -1.760 | 0.0455 | No |