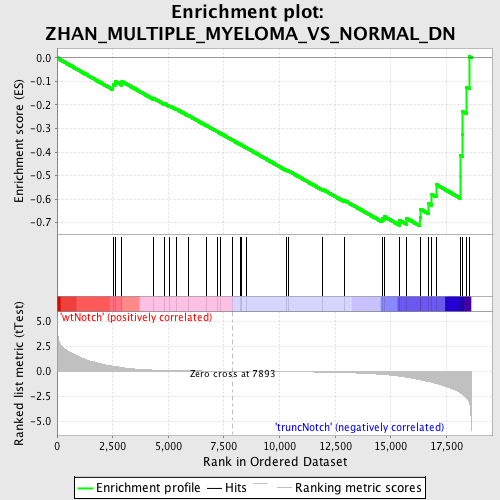
Profile of the Running ES Score & Positions of GeneSet Members on the Rank Ordered List
| Dataset | Set_03_truncNotch_versus_wtNotch.phenotype_truncNotch_versus_wtNotch.cls #wtNotch_versus_truncNotch.phenotype_truncNotch_versus_wtNotch.cls #wtNotch_versus_truncNotch_repos |
| Phenotype | phenotype_truncNotch_versus_wtNotch.cls#wtNotch_versus_truncNotch_repos |
| Upregulated in class | truncNotch |
| GeneSet | ZHAN_MULTIPLE_MYELOMA_VS_NORMAL_DN |
| Enrichment Score (ES) | -0.7144011 |
| Normalized Enrichment Score (NES) | -1.6633171 |
| Nominal p-value | 0.0034188034 |
| FDR q-value | 0.13508105 |
| FWER p-Value | 0.727 |
| PROBE | DESCRIPTION (from dataset) | GENE SYMBOL | GENE_TITLE | RANK IN GENE LIST | RANK METRIC SCORE | RUNNING ES | CORE ENRICHMENT | |
|---|---|---|---|---|---|---|---|---|
| 1 | PRKAR2B | 3130593 5220577 | 2512 | 0.501 | -0.1139 | No | ||
| 2 | MRC1 | 730097 | 2606 | 0.470 | -0.0989 | No | ||
| 3 | AIF1 | 130332 5220017 | 2913 | 0.369 | -0.0997 | No | ||
| 4 | WNT10B | 510050 | 4346 | 0.114 | -0.1720 | No | ||
| 5 | PLA2G7 | 4730092 | 4807 | 0.083 | -0.1932 | No | ||
| 6 | GLDC | 1170324 | 5073 | 0.070 | -0.2045 | No | ||
| 7 | CD24 | 1780091 | 5372 | 0.057 | -0.2181 | No | ||
| 8 | HNMT | 4560022 | 5910 | 0.039 | -0.2453 | No | ||
| 9 | CXCL12 | 580546 4150750 4570068 | 6718 | 0.020 | -0.2879 | No | ||
| 10 | PYGL | 7160520 | 7216 | 0.011 | -0.3142 | No | ||
| 11 | GP5 | 2510088 | 7336 | 0.009 | -0.3202 | No | ||
| 12 | A2M | 6620039 | 7900 | -0.000 | -0.3505 | No | ||
| 13 | MSX1 | 2650309 | 8255 | -0.006 | -0.3693 | No | ||
| 14 | ALDH1A1 | 6520706 | 8288 | -0.006 | -0.3707 | No | ||
| 15 | ITGA2B | 2680538 | 8507 | -0.010 | -0.3820 | No | ||
| 16 | SYK | 6940133 | 10320 | -0.042 | -0.4778 | No | ||
| 17 | ELA2 | 1570452 5270129 | 10402 | -0.045 | -0.4802 | No | ||
| 18 | RNASE6 | 5270563 | 11938 | -0.088 | -0.5591 | No | ||
| 19 | HHEX | 2340575 | 12925 | -0.138 | -0.6063 | No | ||
| 20 | COL1A2 | 380364 | 14606 | -0.319 | -0.6831 | No | ||
| 21 | ITGB2 | 6380348 | 14717 | -0.338 | -0.6747 | No | ||
| 22 | CEBPD | 3360176 | 15386 | -0.485 | -0.6900 | Yes | ||
| 23 | SMPDL3A | 4070253 | 15702 | -0.595 | -0.6817 | Yes | ||
| 24 | VCAM1 | 2900450 | 16311 | -0.852 | -0.6782 | Yes | ||
| 25 | TOMM40 | 6110017 | 16338 | -0.867 | -0.6427 | Yes | ||
| 26 | PF4 | 6130332 | 16706 | -1.023 | -0.6190 | Yes | ||
| 27 | S100A9 | 7050528 | 16846 | -1.091 | -0.5801 | Yes | ||
| 28 | LCN2 | 2510112 | 17048 | -1.231 | -0.5386 | Yes | ||
| 29 | CD72 | 2340369 | 18111 | -2.130 | -0.5052 | Yes | ||
| 30 | CTSH | 60524 | 18112 | -2.131 | -0.4146 | Yes | ||
| 31 | TCF7 | 3800736 5390181 | 18208 | -2.262 | -0.3236 | Yes | ||
| 32 | APOC1 | 5900066 6220408 | 18213 | -2.272 | -0.2272 | Yes | ||
| 33 | IGF2BP3 | 2810161 4230338 | 18402 | -2.664 | -0.1241 | Yes | ||
| 34 | LST1 | 5420372 | 18533 | -3.189 | 0.0045 | Yes |

