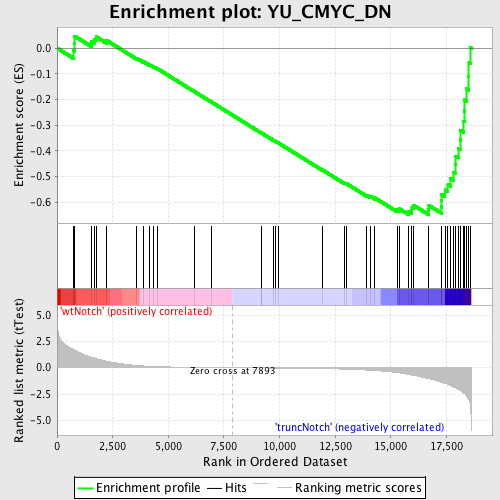
Profile of the Running ES Score & Positions of GeneSet Members on the Rank Ordered List
| Dataset | Set_03_truncNotch_versus_wtNotch.phenotype_truncNotch_versus_wtNotch.cls #wtNotch_versus_truncNotch.phenotype_truncNotch_versus_wtNotch.cls #wtNotch_versus_truncNotch_repos |
| Phenotype | phenotype_truncNotch_versus_wtNotch.cls#wtNotch_versus_truncNotch_repos |
| Upregulated in class | truncNotch |
| GeneSet | YU_CMYC_DN |
| Enrichment Score (ES) | -0.6474599 |
| Normalized Enrichment Score (NES) | -1.6328071 |
| Nominal p-value | 0.0016129032 |
| FDR q-value | 0.15838914 |
| FWER p-Value | 0.904 |
| PROBE | DESCRIPTION (from dataset) | GENE SYMBOL | GENE_TITLE | RANK IN GENE LIST | RANK METRIC SCORE | RUNNING ES | CORE ENRICHMENT | |
|---|---|---|---|---|---|---|---|---|
| 1 | RAG1 | 2850279 | 730 | 1.715 | -0.0090 | No | ||
| 2 | KLF3 | 5130438 | 782 | 1.666 | 0.0177 | No | ||
| 3 | PTPRC | 130402 5290148 | 788 | 1.663 | 0.0469 | No | ||
| 4 | BTG1 | 4200735 6040131 6200133 | 1533 | 1.000 | 0.0245 | No | ||
| 5 | RBMS1 | 6400014 | 1665 | 0.929 | 0.0339 | No | ||
| 6 | RGL2 | 1740017 | 1759 | 0.870 | 0.0443 | No | ||
| 7 | GDI1 | 4590400 5290358 6020687 6180446 | 2224 | 0.611 | 0.0301 | No | ||
| 8 | PRKCB1 | 870019 3130092 | 3577 | 0.207 | -0.0391 | No | ||
| 9 | IFI203 | 6420102 3610369 | 3885 | 0.160 | -0.0528 | No | ||
| 10 | MYO7A | 2810102 | 4131 | 0.134 | -0.0636 | No | ||
| 11 | OLFM1 | 3360161 5570066 | 4318 | 0.117 | -0.0716 | No | ||
| 12 | GBP4 | 6520471 1980670 | 4503 | 0.102 | -0.0797 | No | ||
| 13 | CD1D1 | 5130184 | 6183 | 0.032 | -0.1695 | No | ||
| 14 | SRPK3 | 2480278 | 6941 | 0.016 | -0.2100 | No | ||
| 15 | PYGM | 3940300 | 9201 | -0.022 | -0.3313 | No | ||
| 16 | 1100001G20RIK | 3610368 | 9208 | -0.022 | -0.3313 | No | ||
| 17 | SSPN | 4670091 | 9738 | -0.031 | -0.3592 | No | ||
| 18 | 5730420B22RIK | 130139 | 9833 | -0.033 | -0.3637 | No | ||
| 19 | ABCA1 | 6290156 | 9957 | -0.035 | -0.3697 | No | ||
| 20 | MACF1 | 1340132 2370176 2900750 6590364 | 11913 | -0.087 | -0.4735 | No | ||
| 21 | CMAH | 1660497 3390398 6550040 | 12931 | -0.138 | -0.5258 | No | ||
| 22 | LOC207685 | 6520017 | 13002 | -0.142 | -0.5271 | No | ||
| 23 | MGST1 | 6020605 | 13928 | -0.223 | -0.5729 | No | ||
| 24 | GAD1 | 2360035 3140167 | 14087 | -0.240 | -0.5772 | No | ||
| 25 | H2-OB | 6980059 | 14281 | -0.267 | -0.5829 | No | ||
| 26 | MS4A1 | 4210598 | 15290 | -0.456 | -0.6291 | No | ||
| 27 | ACP5 | 2230717 | 15383 | -0.483 | -0.6255 | No | ||
| 28 | LAPTM5 | 5550372 | 15782 | -0.622 | -0.6359 | Yes | ||
| 29 | SIPA1 | 5220687 | 15944 | -0.687 | -0.6325 | Yes | ||
| 30 | ARID3B | 6650008 | 15950 | -0.692 | -0.6205 | Yes | ||
| 31 | GNS | 3120458 | 16028 | -0.726 | -0.6118 | Yes | ||
| 32 | LTB | 3990672 | 16691 | -1.016 | -0.6295 | Yes | ||
| 33 | H2-AB1 | 4230427 | 16711 | -1.025 | -0.6124 | Yes | ||
| 34 | SLFN2 | 3120114 | 17268 | -1.370 | -0.6181 | Yes | ||
| 35 | DGKA | 5720152 5890328 | 17279 | -1.374 | -0.5943 | Yes | ||
| 36 | H2-EB1 | 2350079 | 17285 | -1.379 | -0.5702 | Yes | ||
| 37 | MAP4K2 | 4200037 | 17435 | -1.482 | -0.5520 | Yes | ||
| 38 | IL4I1 | 3190161 | 17569 | -1.578 | -0.5312 | Yes | ||
| 39 | IGH-1A | 360113 4670341 | 17697 | -1.696 | -0.5081 | Yes | ||
| 40 | CD37 | 770273 | 17830 | -1.825 | -0.4829 | Yes | ||
| 41 | CD2 | 430672 | 17893 | -1.885 | -0.4529 | Yes | ||
| 42 | H2-AA | 5290673 | 17920 | -1.916 | -0.4204 | Yes | ||
| 43 | H2-DMB1 | 4760026 | 18041 | -2.040 | -0.3908 | Yes | ||
| 44 | CTSH | 60524 | 18112 | -2.131 | -0.3569 | Yes | ||
| 45 | GGA2 | 520451 1240082 2650332 | 18140 | -2.164 | -0.3200 | Yes | ||
| 46 | IL10RA | 1770164 | 18267 | -2.369 | -0.2849 | Yes | ||
| 47 | ARHGEF1 | 610347 4850603 6420672 | 18297 | -2.412 | -0.2438 | Yes | ||
| 48 | BLK | 1940128 5390053 | 18327 | -2.471 | -0.2017 | Yes | ||
| 49 | EVL | 1740113 | 18415 | -2.713 | -0.1584 | Yes | ||
| 50 | H2-DMA | 6290463 | 18507 | -3.020 | -0.1098 | Yes | ||
| 51 | KLF2 | 6860270 | 18512 | -3.049 | -0.0561 | Yes | ||
| 52 | UNC93B1 | 430152 | 18575 | -3.487 | 0.0022 | Yes |

