Profile of the Running ES Score & Positions of GeneSet Members on the Rank Ordered List
| Dataset | Set_03_truncNotch_versus_wtNotch.phenotype_truncNotch_versus_wtNotch.cls #wtNotch_versus_truncNotch.phenotype_truncNotch_versus_wtNotch.cls #wtNotch_versus_truncNotch_repos |
| Phenotype | phenotype_truncNotch_versus_wtNotch.cls#wtNotch_versus_truncNotch_repos |
| Upregulated in class | truncNotch |
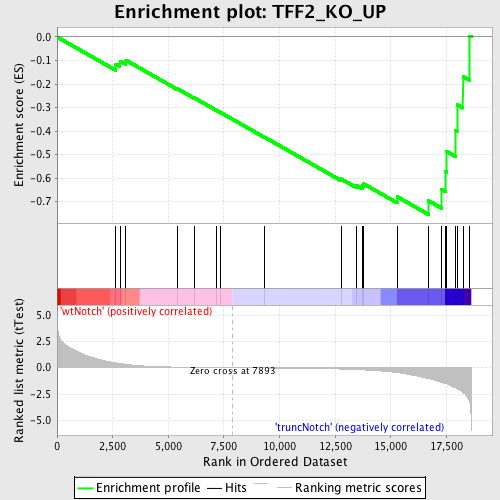
| GeneSet | TFF2_KO_UP |
| Enrichment Score (ES) | -0.754631 |
| Normalized Enrichment Score (NES) | -1.5869738 |
| Nominal p-value | 0.0072332732 |
| FDR q-value | 0.1971727 |
| FWER p-Value | 0.991 |
| PROBE | DESCRIPTION (from dataset) | GENE SYMBOL | GENE_TITLE | RANK IN GENE LIST | RANK METRIC SCORE | RUNNING ES | CORE ENRICHMENT | |
|---|---|---|---|---|---|---|---|---|
| 1 | GNB1 | 2120397 | 2641 | 0.459 | -0.1156 | No | ||
| 2 | OGFR | 5700397 | 2826 | 0.398 | -0.1027 | No | ||
| 3 | CD52 | 5910242 | 3091 | 0.315 | -0.0987 | No | ||
| 4 | APOA4 | 4120451 | 5402 | 0.056 | -0.2197 | No | ||
| 5 | SLC2A2 | 5130537 5720722 6770079 | 6166 | 0.033 | -0.2589 | No | ||
| 6 | DPEP1 | 5080014 | 7149 | 0.012 | -0.3110 | No | ||
| 7 | PTPN22 | 1690647 7100239 | 7334 | 0.009 | -0.3204 | No | ||
| 8 | ABCG2 | 6370056 | 9341 | -0.024 | -0.4268 | No | ||
| 9 | RBP2 | 2060097 | 12767 | -0.127 | -0.6037 | No | ||
| 10 | KDELR2 | 450465 6900095 | 13446 | -0.176 | -0.6300 | No | ||
| 11 | BCAT2 | 5890112 | 13715 | -0.201 | -0.6329 | No | ||
| 12 | SAMHD1 | 2350338 5390451 | 13762 | -0.207 | -0.6235 | No | ||
| 13 | MS4A1 | 4210598 | 15290 | -0.456 | -0.6793 | No | ||
| 14 | LTB | 3990672 | 16691 | -1.016 | -0.6962 | Yes | ||
| 15 | DGKA | 5720152 5890328 | 17279 | -1.374 | -0.6487 | Yes | ||
| 16 | IRF7 | 1570605 | 17457 | -1.493 | -0.5724 | Yes | ||
| 17 | CCL8 | 3870010 | 17515 | -1.535 | -0.4871 | Yes | ||
| 18 | PSMB8 | 2850707 | 17924 | -1.918 | -0.3987 | Yes | ||
| 19 | TFF3 | 1580129 | 17978 | -1.979 | -0.2877 | Yes | ||
| 20 | TAP1 | 4050047 | 18244 | -2.324 | -0.1683 | Yes | ||
| 21 | CRIP1 | 4590377 | 18548 | -3.274 | 0.0037 | Yes |

