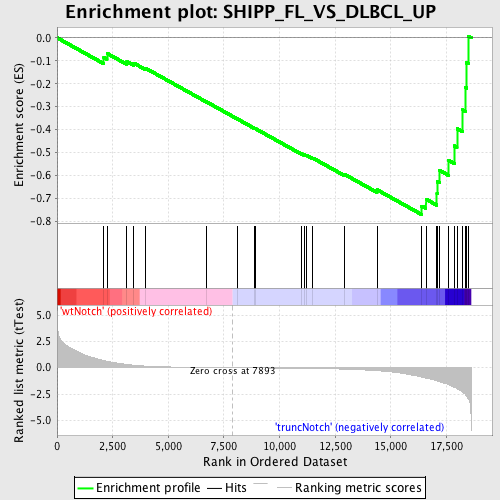
Profile of the Running ES Score & Positions of GeneSet Members on the Rank Ordered List
| Dataset | Set_03_truncNotch_versus_wtNotch.phenotype_truncNotch_versus_wtNotch.cls #wtNotch_versus_truncNotch.phenotype_truncNotch_versus_wtNotch.cls #wtNotch_versus_truncNotch_repos |
| Phenotype | phenotype_truncNotch_versus_wtNotch.cls#wtNotch_versus_truncNotch_repos |
| Upregulated in class | truncNotch |
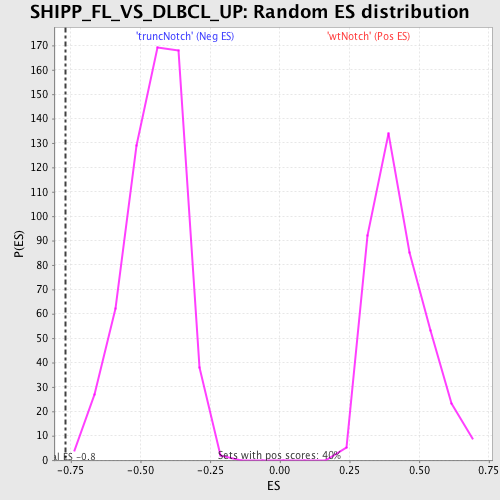
| GeneSet | SHIPP_FL_VS_DLBCL_UP |
| Enrichment Score (ES) | -0.7691221 |
| Normalized Enrichment Score (NES) | -1.7067878 |
| Nominal p-value | 0.001669449 |
| FDR q-value | 0.08021865 |
| FWER p-Value | 0.377 |
| PROBE | DESCRIPTION (from dataset) | GENE SYMBOL | GENE_TITLE | RANK IN GENE LIST | RANK METRIC SCORE | RUNNING ES | CORE ENRICHMENT | |
|---|---|---|---|---|---|---|---|---|
| 1 | TCF20 | 1190338 1240520 4070594 4810440 | 2101 | 0.671 | -0.0853 | No | ||
| 2 | CD180 | 360048 1410440 2850440 | 2243 | 0.604 | -0.0679 | No | ||
| 3 | CD69 | 380167 4730088 | 3135 | 0.303 | -0.1033 | No | ||
| 4 | LY9 | 3360315 4070292 | 3447 | 0.234 | -0.1103 | No | ||
| 5 | ITGA4 | 2470739 | 3968 | 0.151 | -0.1321 | No | ||
| 6 | CD40LG | 3120270 | 6716 | 0.020 | -0.2790 | No | ||
| 7 | POU6F1 | 6200168 | 8098 | -0.003 | -0.3531 | No | ||
| 8 | RHOH | 130184 | 8849 | -0.015 | -0.3928 | No | ||
| 9 | SEPP1 | 450273 | 8914 | -0.017 | -0.3956 | No | ||
| 10 | ANK2 | 6510546 | 10979 | -0.058 | -0.5042 | No | ||
| 11 | TCEAL1 | 870577 | 11124 | -0.062 | -0.5094 | No | ||
| 12 | TXK | 2320338 | 11219 | -0.065 | -0.5118 | No | ||
| 13 | HSPA1L | 4010538 | 11494 | -0.073 | -0.5235 | No | ||
| 14 | STX16 | 70315 | 12908 | -0.136 | -0.5939 | No | ||
| 15 | TRAF5 | 3290064 | 14379 | -0.278 | -0.6615 | No | ||
| 16 | DNASE1L3 | 670086 | 16381 | -0.888 | -0.7324 | Yes | ||
| 17 | GLIPR1 | 3360750 | 16581 | -0.980 | -0.7026 | Yes | ||
| 18 | CD3D | 2810739 | 17073 | -1.243 | -0.6776 | Yes | ||
| 19 | ZMYND11 | 630181 2570019 4850138 5360040 | 17097 | -1.258 | -0.6269 | Yes | ||
| 20 | TRIB2 | 4120605 | 17181 | -1.321 | -0.5767 | Yes | ||
| 21 | INPP1 | 670368 | 17590 | -1.595 | -0.5327 | Yes | ||
| 22 | RAPSN | 610110 2370162 | 17857 | -1.848 | -0.4706 | Yes | ||
| 23 | PDCD1 | 4120082 | 17975 | -1.976 | -0.3953 | Yes | ||
| 24 | CIRBP | 1850408 | 18234 | -2.305 | -0.3138 | Yes | ||
| 25 | HES1 | 4810280 | 18347 | -2.504 | -0.2163 | Yes | ||
| 26 | CLU | 5420075 | 18405 | -2.667 | -0.1091 | Yes | ||
| 27 | GPR18 | 2640551 | 18482 | -2.913 | 0.0072 | Yes |