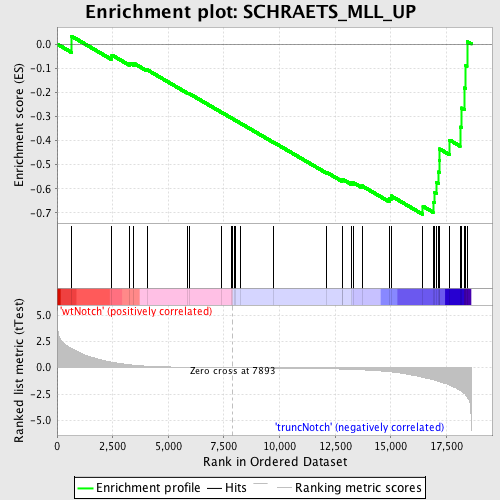
Profile of the Running ES Score & Positions of GeneSet Members on the Rank Ordered List
| Dataset | Set_03_truncNotch_versus_wtNotch.phenotype_truncNotch_versus_wtNotch.cls #wtNotch_versus_truncNotch.phenotype_truncNotch_versus_wtNotch.cls #wtNotch_versus_truncNotch_repos |
| Phenotype | phenotype_truncNotch_versus_wtNotch.cls#wtNotch_versus_truncNotch_repos |
| Upregulated in class | truncNotch |
| GeneSet | SCHRAETS_MLL_UP |
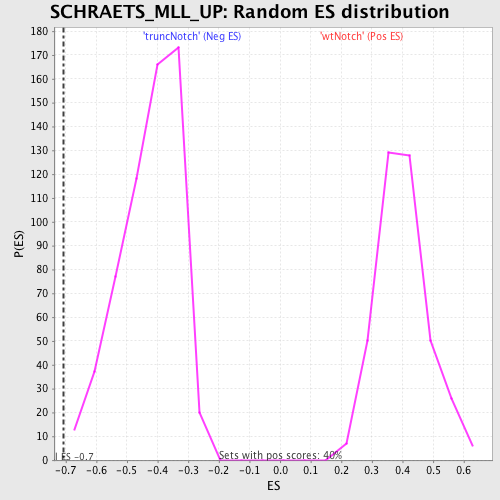
| Enrichment Score (ES) | -0.7067778 |
| Normalized Enrichment Score (NES) | -1.6665754 |
| Nominal p-value | 0.0016556291 |
| FDR q-value | 0.14438988 |
| FWER p-Value | 0.699 |
| PROBE | DESCRIPTION (from dataset) | GENE SYMBOL | GENE_TITLE | RANK IN GENE LIST | RANK METRIC SCORE | RUNNING ES | CORE ENRICHMENT | |
|---|---|---|---|---|---|---|---|---|
| 1 | ACADM | 460112 3390113 | 644 | 1.811 | 0.0327 | No | ||
| 2 | COL6A1 | 1410670 2940091 6510086 | 2461 | 0.518 | -0.0457 | No | ||
| 3 | MGLL | 2030446 4210520 | 3275 | 0.271 | -0.0794 | No | ||
| 4 | GATA6 | 1770010 | 3437 | 0.236 | -0.0793 | No | ||
| 5 | CDKN1B | 3800025 6450044 | 4044 | 0.142 | -0.1066 | No | ||
| 6 | GAS1 | 2120504 | 5869 | 0.041 | -0.2033 | No | ||
| 7 | TCF2 | 870338 5050632 | 5933 | 0.039 | -0.2052 | No | ||
| 8 | PITX2 | 870537 2690139 | 7394 | 0.008 | -0.2835 | No | ||
| 9 | ENPP2 | 5860546 | 7831 | 0.001 | -0.3069 | No | ||
| 10 | FOXC2 | 4150041 | 7882 | 0.000 | -0.3096 | No | ||
| 11 | IL1RN | 2370333 | 7976 | -0.001 | -0.3146 | No | ||
| 12 | 2810453I06RIK | 610132 4280593 5220139 | 7997 | -0.002 | -0.3156 | No | ||
| 13 | DFFB | 1770092 | 8236 | -0.006 | -0.3282 | No | ||
| 14 | GREM1 | 3940180 | 9722 | -0.030 | -0.4070 | No | ||
| 15 | PLF | 3830047 | 12108 | -0.095 | -0.5318 | No | ||
| 16 | THBS2 | 2850136 | 12809 | -0.130 | -0.5646 | No | ||
| 17 | SPRR1A | 3870064 | 12840 | -0.132 | -0.5613 | No | ||
| 18 | HOXC8 | 6220050 | 13209 | -0.157 | -0.5753 | No | ||
| 19 | THBD | 1500092 | 13335 | -0.167 | -0.5758 | No | ||
| 20 | AGT | 7000575 | 13704 | -0.200 | -0.5881 | No | ||
| 21 | COL6A3 | 2640717 4070064 5390717 | 14929 | -0.376 | -0.6400 | No | ||
| 22 | CCL9 | 4610725 | 15013 | -0.396 | -0.6298 | No | ||
| 23 | MVK | 1450717 | 16445 | -0.913 | -0.6728 | Yes | ||
| 24 | CAP1 | 2650278 | 16901 | -1.136 | -0.6551 | Yes | ||
| 25 | CD53 | 5550162 | 16976 | -1.178 | -0.6152 | Yes | ||
| 26 | ARHGDIB | 4730433 | 17043 | -1.226 | -0.5732 | Yes | ||
| 27 | COL6A2 | 1780142 | 17137 | -1.282 | -0.5305 | Yes | ||
| 28 | CD93 | 6770180 | 17175 | -1.318 | -0.4835 | Yes | ||
| 29 | HSPB8 | 540563 | 17195 | -1.327 | -0.4351 | Yes | ||
| 30 | MGP | 6900736 | 17642 | -1.640 | -0.3981 | Yes | ||
| 31 | CTSH | 60524 | 18112 | -2.131 | -0.3441 | Yes | ||
| 32 | TWIST2 | 6760433 | 18167 | -2.197 | -0.2652 | Yes | ||
| 33 | GSTA4 | 1660369 | 18321 | -2.453 | -0.1822 | Yes | ||
| 34 | LIMK1 | 5080064 | 18371 | -2.580 | -0.0889 | Yes | ||
| 35 | TGFBI | 2060446 6900112 | 18425 | -2.742 | 0.0103 | Yes |