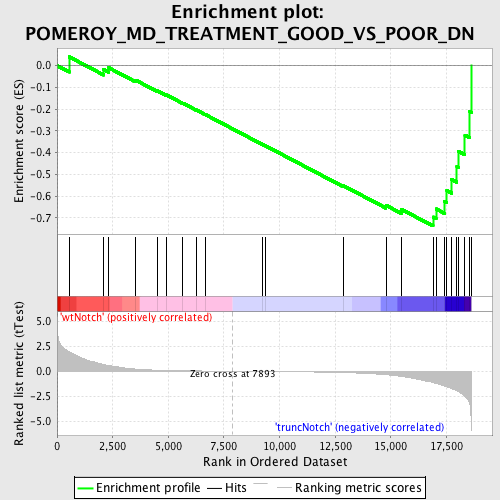
Profile of the Running ES Score & Positions of GeneSet Members on the Rank Ordered List
| Dataset | Set_03_truncNotch_versus_wtNotch.phenotype_truncNotch_versus_wtNotch.cls #wtNotch_versus_truncNotch.phenotype_truncNotch_versus_wtNotch.cls #wtNotch_versus_truncNotch_repos |
| Phenotype | phenotype_truncNotch_versus_wtNotch.cls#wtNotch_versus_truncNotch_repos |
| Upregulated in class | truncNotch |
| GeneSet | POMEROY_MD_TREATMENT_GOOD_VS_POOR_DN |
| Enrichment Score (ES) | -0.73683447 |
| Normalized Enrichment Score (NES) | -1.6348789 |
| Nominal p-value | 0.0068610637 |
| FDR q-value | 0.16650873 |
| FWER p-Value | 0.896 |
| PROBE | DESCRIPTION (from dataset) | GENE SYMBOL | GENE_TITLE | RANK IN GENE LIST | RANK METRIC SCORE | RUNNING ES | CORE ENRICHMENT | |
|---|---|---|---|---|---|---|---|---|
| 1 | UBE2D3 | 3190452 | 542 | 1.915 | 0.0406 | No | ||
| 2 | DAG1 | 460053 610341 | 2096 | 0.673 | -0.0184 | No | ||
| 3 | BARD1 | 3170348 | 2323 | 0.574 | -0.0097 | No | ||
| 4 | TRAP1 | 6040168 | 3518 | 0.220 | -0.0659 | No | ||
| 5 | FGFR3 | 5390632 6020021 | 4516 | 0.101 | -0.1158 | No | ||
| 6 | NME4 | 3140736 5900446 | 4913 | 0.077 | -0.1343 | No | ||
| 7 | RPL11 | 3780435 | 5640 | 0.047 | -0.1717 | No | ||
| 8 | E2F5 | 5860575 | 6252 | 0.031 | -0.2034 | No | ||
| 9 | CENPF | 5050088 | 6665 | 0.022 | -0.2248 | No | ||
| 10 | BYSL | 3170110 | 9221 | -0.022 | -0.3614 | No | ||
| 11 | CBX5 | 3830072 6290167 | 9360 | -0.024 | -0.3679 | No | ||
| 12 | RPS18 | 670132 1230148 2030722 | 12858 | -0.133 | -0.5512 | No | ||
| 13 | GABRG2 | 2350402 4210204 6130279 6550037 | 14783 | -0.348 | -0.6420 | No | ||
| 14 | ERP29 | 4050441 | 15476 | -0.515 | -0.6605 | No | ||
| 15 | CAD | 2340717 | 16897 | -1.133 | -0.6956 | Yes | ||
| 16 | SLC29A1 | 2970379 | 17035 | -1.218 | -0.6586 | Yes | ||
| 17 | SRI | 3390446 4850064 | 17412 | -1.470 | -0.6253 | Yes | ||
| 18 | CDC25B | 6940102 | 17519 | -1.538 | -0.5750 | Yes | ||
| 19 | RPS19 | 5860066 | 17730 | -1.724 | -0.5235 | Yes | ||
| 20 | RPL10A | 4850066 | 17970 | -1.973 | -0.4645 | Yes | ||
| 21 | SNRPD2 | 6110035 | 18030 | -2.033 | -0.3936 | Yes | ||
| 22 | B4GALT1 | 6980167 | 18332 | -2.483 | -0.3194 | Yes | ||
| 23 | CRIP1 | 4590377 | 18548 | -3.274 | -0.2117 | Yes | ||
| 24 | RPL27A | 3130451 110195 6840494 | 18616 | -5.912 | 0.0000 | Yes |

