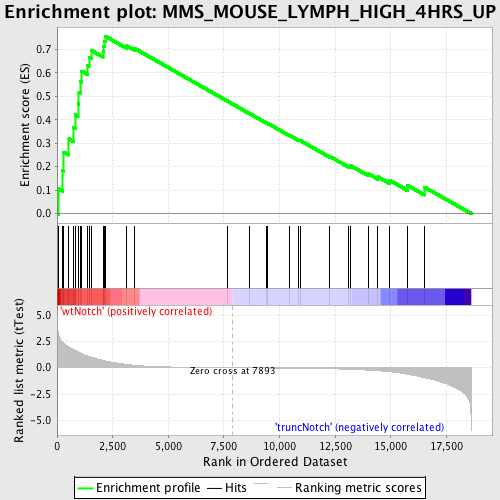
Profile of the Running ES Score & Positions of GeneSet Members on the Rank Ordered List
| Dataset | Set_03_truncNotch_versus_wtNotch.phenotype_truncNotch_versus_wtNotch.cls #wtNotch_versus_truncNotch.phenotype_truncNotch_versus_wtNotch.cls #wtNotch_versus_truncNotch_repos |
| Phenotype | phenotype_truncNotch_versus_wtNotch.cls#wtNotch_versus_truncNotch_repos |
| Upregulated in class | wtNotch |
| GeneSet | MMS_MOUSE_LYMPH_HIGH_4HRS_UP |
| Enrichment Score (ES) | 0.75637263 |
| Normalized Enrichment Score (NES) | 1.8895743 |
| Nominal p-value | 0.0 |
| FDR q-value | 0.030170845 |
| FWER p-Value | 0.025 |
| PROBE | DESCRIPTION (from dataset) | GENE SYMBOL | GENE_TITLE | RANK IN GENE LIST | RANK METRIC SCORE | RUNNING ES | CORE ENRICHMENT | |
|---|---|---|---|---|---|---|---|---|
| 1 | PRKAR1A | 3450369 | 66 | 3.071 | 0.1054 | Yes | ||
| 2 | DCK | 6900411 | 241 | 2.451 | 0.1830 | Yes | ||
| 3 | PELI1 | 3870215 6900040 | 299 | 2.326 | 0.2624 | Yes | ||
| 4 | UBE1C | 6040341 | 533 | 1.931 | 0.3184 | Yes | ||
| 5 | RBBP7 | 430113 450450 2370309 | 748 | 1.701 | 0.3672 | Yes | ||
| 6 | VBP1 | 4070050 | 810 | 1.639 | 0.4220 | Yes | ||
| 7 | XBP1 | 3840594 | 939 | 1.491 | 0.4680 | Yes | ||
| 8 | PGRMC1 | 4150692 | 981 | 1.451 | 0.5173 | Yes | ||
| 9 | CCRN4L | 50438 5130372 | 1045 | 1.389 | 0.5632 | Yes | ||
| 10 | ATP6V1A | 6590242 | 1103 | 1.330 | 0.6073 | Yes | ||
| 11 | TXNRD1 | 6590446 | 1371 | 1.098 | 0.6319 | Yes | ||
| 12 | RRM2 | 6350059 6940162 | 1434 | 1.046 | 0.6656 | Yes | ||
| 13 | GAS5 | 1980136 4210551 | 1550 | 0.998 | 0.6948 | Yes | ||
| 14 | CXCR4 | 4590519 | 2064 | 0.686 | 0.6916 | Yes | ||
| 15 | MARK2 | 7210608 | 2090 | 0.675 | 0.7142 | Yes | ||
| 16 | RBBP6 | 2320129 | 2142 | 0.650 | 0.7345 | Yes | ||
| 17 | CDC6 | 4570296 5360600 | 2159 | 0.641 | 0.7564 | Yes | ||
| 18 | FEN1 | 1770541 | 3136 | 0.302 | 0.7146 | No | ||
| 19 | VPS4B | 3440332 | 3498 | 0.225 | 0.7031 | No | ||
| 20 | SP3 | 3840338 | 7643 | 0.004 | 0.4803 | No | ||
| 21 | HMGB3 | 2940168 | 8648 | -0.012 | 0.4267 | No | ||
| 22 | RCN2 | 840324 | 9398 | -0.025 | 0.3873 | No | ||
| 23 | PTDSS1 | 6020215 | 9467 | -0.026 | 0.3845 | No | ||
| 24 | PSMA3 | 5900047 7040161 | 10440 | -0.045 | 0.3338 | No | ||
| 25 | RAB18 | 3120575 4590577 | 10858 | -0.055 | 0.3134 | No | ||
| 26 | LYPLA1 | 4480373 5570551 | 10923 | -0.056 | 0.3119 | No | ||
| 27 | LMO4 | 3800746 | 12260 | -0.101 | 0.2436 | No | ||
| 28 | ACTG1 | 540215 | 13115 | -0.151 | 0.2030 | No | ||
| 29 | NQO1 | 3450136 6840121 | 13202 | -0.156 | 0.2039 | No | ||
| 30 | PLK4 | 430162 5720110 | 14001 | -0.232 | 0.1692 | No | ||
| 31 | CYB5A | 5080450 | 14422 | -0.285 | 0.1567 | No | ||
| 32 | EIF1AY | 1230541 6130301 | 14955 | -0.383 | 0.1417 | No | ||
| 33 | EIF4A2 | 1170494 1740711 2850504 | 15750 | -0.611 | 0.1206 | No | ||
| 34 | HNRPDL | 1050102 1090181 5360471 | 16516 | -0.946 | 0.1130 | No |

