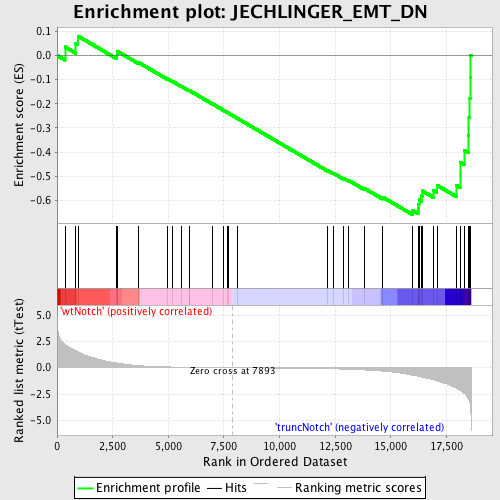
Profile of the Running ES Score & Positions of GeneSet Members on the Rank Ordered List
| Dataset | Set_03_truncNotch_versus_wtNotch.phenotype_truncNotch_versus_wtNotch.cls #wtNotch_versus_truncNotch.phenotype_truncNotch_versus_wtNotch.cls #wtNotch_versus_truncNotch_repos |
| Phenotype | phenotype_truncNotch_versus_wtNotch.cls#wtNotch_versus_truncNotch_repos |
| Upregulated in class | truncNotch |
| GeneSet | JECHLINGER_EMT_DN |
| Enrichment Score (ES) | -0.6585047 |
| Normalized Enrichment Score (NES) | -1.5991037 |
| Nominal p-value | 0.008517887 |
| FDR q-value | 0.17116022 |
| FWER p-Value | 0.985 |
| PROBE | DESCRIPTION (from dataset) | GENE SYMBOL | GENE_TITLE | RANK IN GENE LIST | RANK METRIC SCORE | RUNNING ES | CORE ENRICHMENT | |
|---|---|---|---|---|---|---|---|---|
| 1 | BCL6 | 940100 | 355 | 2.213 | 0.0351 | No | ||
| 2 | ATP1A1 | 5670451 | 839 | 1.613 | 0.0486 | No | ||
| 3 | ITPR1 | 3450519 | 938 | 1.492 | 0.0799 | No | ||
| 4 | TIMP3 | 1450504 1980270 | 2689 | 0.443 | -0.0035 | No | ||
| 5 | JUP | 2510671 | 2691 | 0.443 | 0.0073 | No | ||
| 6 | TGFB3 | 1070041 | 2702 | 0.438 | 0.0175 | No | ||
| 7 | AMD1 | 6290128 | 3642 | 0.198 | -0.0282 | No | ||
| 8 | NUMB | 2450735 3800253 6350040 | 4956 | 0.075 | -0.0970 | No | ||
| 9 | EGR2 | 3800403 | 5178 | 0.065 | -0.1073 | No | ||
| 10 | FOSB | 1940142 | 5598 | 0.049 | -0.1287 | No | ||
| 11 | F3 | 2940180 | 5931 | 0.039 | -0.1456 | No | ||
| 12 | THBS1 | 4560494 430288 | 5939 | 0.039 | -0.1450 | No | ||
| 13 | KITLG | 2120047 6220300 | 6993 | 0.015 | -0.2014 | No | ||
| 14 | TACSTD1 | 3780025 | 7485 | 0.007 | -0.2276 | No | ||
| 15 | SERPINB5 | 6940050 | 7673 | 0.004 | -0.2376 | No | ||
| 16 | PKP1 | 1500433 | 7697 | 0.003 | -0.2388 | No | ||
| 17 | RARA | 4050161 | 8105 | -0.003 | -0.2606 | No | ||
| 18 | ATF3 | 1940546 | 12166 | -0.097 | -0.4767 | No | ||
| 19 | FBP2 | 1580193 | 12411 | -0.109 | -0.4872 | No | ||
| 20 | CTGF | 4540577 | 12887 | -0.135 | -0.5095 | No | ||
| 21 | HMMR | 5720315 6380168 | 13085 | -0.148 | -0.5165 | No | ||
| 22 | NNT | 540253 1170471 5550092 6760397 | 13794 | -0.209 | -0.5494 | No | ||
| 23 | IRF6 | 840241 2640139 4050373 6840471 | 14631 | -0.323 | -0.5865 | No | ||
| 24 | SGK | 1400131 2480056 | 15969 | -0.698 | -0.6414 | Yes | ||
| 25 | CDH1 | 1940736 | 16225 | -0.809 | -0.6353 | Yes | ||
| 26 | ITGB5 | 70129 | 16258 | -0.828 | -0.6167 | Yes | ||
| 27 | STAT5A | 2680458 | 16269 | -0.833 | -0.5969 | Yes | ||
| 28 | VAMP8 | 380411 1190139 | 16383 | -0.888 | -0.5812 | Yes | ||
| 29 | GRB7 | 2100471 | 16420 | -0.901 | -0.5611 | Yes | ||
| 30 | MYH9 | 3120091 4850292 | 16930 | -1.154 | -0.5602 | Yes | ||
| 31 | TIAM1 | 5420288 | 17075 | -1.244 | -0.5375 | Yes | ||
| 32 | EGR1 | 4610347 | 17946 | -1.942 | -0.5368 | Yes | ||
| 33 | CTSH | 60524 | 18112 | -2.131 | -0.4935 | Yes | ||
| 34 | TGM2 | 5360452 | 18113 | -2.131 | -0.4413 | Yes | ||
| 35 | ARHGEF1 | 610347 4850603 6420672 | 18297 | -2.412 | -0.3920 | Yes | ||
| 36 | PADI2 | 2940092 6420136 | 18499 | -2.975 | -0.3300 | Yes | ||
| 37 | KLF2 | 6860270 | 18512 | -3.049 | -0.2560 | Yes | ||
| 38 | FLNA | 5390193 | 18554 | -3.307 | -0.1772 | Yes | ||
| 39 | ACTN4 | 3840301 4590390 7050132 | 18583 | -3.637 | -0.0896 | Yes | ||
| 40 | DUSP1 | 6860121 | 18587 | -3.727 | 0.0016 | Yes |

