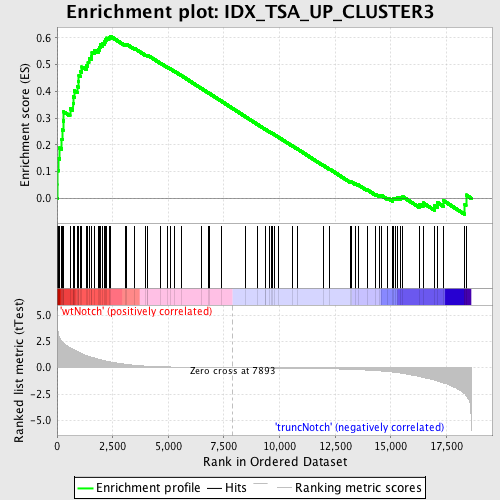
Profile of the Running ES Score & Positions of GeneSet Members on the Rank Ordered List
| Dataset | Set_03_truncNotch_versus_wtNotch.phenotype_truncNotch_versus_wtNotch.cls #wtNotch_versus_truncNotch.phenotype_truncNotch_versus_wtNotch.cls #wtNotch_versus_truncNotch_repos |
| Phenotype | phenotype_truncNotch_versus_wtNotch.cls#wtNotch_versus_truncNotch_repos |
| Upregulated in class | wtNotch |
| GeneSet | IDX_TSA_UP_CLUSTER3 |
| Enrichment Score (ES) | 0.6068228 |
| Normalized Enrichment Score (NES) | 1.7516346 |
| Nominal p-value | 0.0 |
| FDR q-value | 0.047914844 |
| FWER p-Value | 0.413 |
| PROBE | DESCRIPTION (from dataset) | GENE SYMBOL | GENE_TITLE | RANK IN GENE LIST | RANK METRIC SCORE | RUNNING ES | CORE ENRICHMENT | |
|---|---|---|---|---|---|---|---|---|
| 1 | CSTF2 | 6040463 | 33 | 3.529 | 0.0509 | Yes | ||
| 2 | FIGNL1 | 6860390 | 35 | 3.510 | 0.1033 | Yes | ||
| 3 | NCAPH | 6220435 | 56 | 3.183 | 0.1498 | Yes | ||
| 4 | CDCA7 | 3060097 | 116 | 2.812 | 0.1886 | Yes | ||
| 5 | CCNB1 | 4590433 4780372 | 211 | 2.518 | 0.2211 | Yes | ||
| 6 | DCK | 6900411 | 241 | 2.451 | 0.2562 | Yes | ||
| 7 | MAD2L1 | 4480725 | 273 | 2.379 | 0.2900 | Yes | ||
| 8 | NASP | 2260139 2940369 5130707 | 298 | 2.326 | 0.3235 | Yes | ||
| 9 | RRM1 | 4150433 | 581 | 1.872 | 0.3362 | Yes | ||
| 10 | NUSAP1 | 940048 3120435 | 714 | 1.733 | 0.3550 | Yes | ||
| 11 | RAD51AP1 | 4050736 6370528 | 731 | 1.714 | 0.3797 | Yes | ||
| 12 | KIF4A | 1410465 4760070 | 778 | 1.670 | 0.4022 | Yes | ||
| 13 | MCM4 | 2760673 5420711 | 904 | 1.538 | 0.4184 | Yes | ||
| 14 | PRC1 | 870092 5890204 | 962 | 1.472 | 0.4373 | Yes | ||
| 15 | ILF2 | 2900253 | 979 | 1.455 | 0.4582 | Yes | ||
| 16 | CCNE2 | 3120537 | 1049 | 1.388 | 0.4752 | Yes | ||
| 17 | CDCA8 | 2340286 6980019 | 1114 | 1.320 | 0.4914 | Yes | ||
| 18 | AURKA | 780537 | 1317 | 1.140 | 0.4976 | Yes | ||
| 19 | INCENP | 520593 | 1387 | 1.082 | 0.5100 | Yes | ||
| 20 | RRM2 | 6350059 6940162 | 1434 | 1.046 | 0.5232 | Yes | ||
| 21 | PRIM1 | 6420746 | 1539 | 0.999 | 0.5325 | Yes | ||
| 22 | MAN2A1 | 6650176 | 1566 | 0.990 | 0.5459 | Yes | ||
| 23 | TFDP1 | 1980112 | 1671 | 0.926 | 0.5541 | Yes | ||
| 24 | TACC3 | 5130592 | 1848 | 0.814 | 0.5567 | Yes | ||
| 25 | BIRC5 | 110408 580014 1770632 | 1894 | 0.790 | 0.5661 | Yes | ||
| 26 | DLG7 | 3120041 | 1942 | 0.763 | 0.5750 | Yes | ||
| 27 | CDC45L | 70537 3130114 | 2050 | 0.690 | 0.5795 | Yes | ||
| 28 | TRIP13 | 6860341 | 2123 | 0.659 | 0.5854 | Yes | ||
| 29 | CDC6 | 4570296 5360600 | 2159 | 0.641 | 0.5931 | Yes | ||
| 30 | BZW1 | 460270 | 2208 | 0.619 | 0.5998 | Yes | ||
| 31 | MCM7 | 3290292 5220056 | 2334 | 0.569 | 0.6016 | Yes | ||
| 32 | SMC2 | 4810133 | 2389 | 0.548 | 0.6068 | Yes | ||
| 33 | KIF22 | 1190368 | 3067 | 0.321 | 0.5751 | No | ||
| 34 | FEN1 | 1770541 | 3136 | 0.302 | 0.5759 | No | ||
| 35 | RAD51 | 6110450 6980280 | 3499 | 0.225 | 0.5598 | No | ||
| 36 | EZH2 | 6130605 6380524 | 3983 | 0.150 | 0.5359 | No | ||
| 37 | AQP1 | 450338 6020292 | 4056 | 0.140 | 0.5342 | No | ||
| 38 | TOPBP1 | 6020333 | 4067 | 0.139 | 0.5357 | No | ||
| 39 | HMGB2 | 2640603 | 4666 | 0.091 | 0.5048 | No | ||
| 40 | HGF | 3360593 | 4957 | 0.075 | 0.4903 | No | ||
| 41 | SLBP | 6220601 | 5075 | 0.069 | 0.4850 | No | ||
| 42 | MCM10 | 4920632 | 5254 | 0.062 | 0.4763 | No | ||
| 43 | CCNB2 | 6510528 | 5570 | 0.050 | 0.4601 | No | ||
| 44 | TTK | 3800129 | 6467 | 0.026 | 0.4121 | No | ||
| 45 | CCNF | 6370288 | 6786 | 0.019 | 0.3952 | No | ||
| 46 | KIF2C | 6940082 | 6866 | 0.018 | 0.3913 | No | ||
| 47 | KLF5 | 3840348 | 7368 | 0.009 | 0.3644 | No | ||
| 48 | BUB1 | 5390270 | 8457 | -0.009 | 0.3058 | No | ||
| 49 | POLA1 | 4760541 | 9007 | -0.018 | 0.2764 | No | ||
| 50 | KIF11 | 5390139 | 9371 | -0.025 | 0.2572 | No | ||
| 51 | CSRP2 | 1030575 | 9375 | -0.025 | 0.2574 | No | ||
| 52 | CKS2 | 1410156 | 9553 | -0.028 | 0.2483 | No | ||
| 53 | HELLS | 4560086 4810025 | 9648 | -0.029 | 0.2437 | No | ||
| 54 | PTGFR | 3850373 | 9671 | -0.030 | 0.2429 | No | ||
| 55 | WNT4 | 4150619 | 9755 | -0.031 | 0.2389 | No | ||
| 56 | ABCA1 | 6290156 | 9957 | -0.035 | 0.2286 | No | ||
| 57 | IL13RA1 | 5550609 | 10557 | -0.048 | 0.1970 | No | ||
| 58 | OSMR | 1990519 | 10784 | -0.053 | 0.1856 | No | ||
| 59 | BRCA1 | 4780669 | 11972 | -0.090 | 0.1229 | No | ||
| 60 | LMO4 | 3800746 | 12260 | -0.101 | 0.1089 | No | ||
| 61 | NQO1 | 3450136 6840121 | 13202 | -0.156 | 0.0605 | No | ||
| 62 | PLK1 | 1780369 2640121 | 13227 | -0.159 | 0.0615 | No | ||
| 63 | MCM3 | 5570068 | 13403 | -0.172 | 0.0547 | No | ||
| 64 | KIF20A | 2650050 | 13526 | -0.183 | 0.0508 | No | ||
| 65 | USP1 | 2760541 5690438 6220673 | 13945 | -0.225 | 0.0317 | No | ||
| 66 | CX3CL1 | 3990707 | 14317 | -0.272 | 0.0157 | No | ||
| 67 | LRP5 | 2100397 3170484 | 14478 | -0.295 | 0.0115 | No | ||
| 68 | IMPDH2 | 5220138 | 14567 | -0.313 | 0.0114 | No | ||
| 69 | SLCO3A1 | 1050408 2370156 6110072 | 14869 | -0.363 | 0.0006 | No | ||
| 70 | MCM5 | 2680647 | 15085 | -0.411 | -0.0049 | No | ||
| 71 | CDC20 | 3440017 3440044 6220088 | 15103 | -0.413 | 0.0004 | No | ||
| 72 | RACGAP1 | 3990162 6620736 | 15208 | -0.437 | 0.0013 | No | ||
| 73 | MCM2 | 5050139 | 15297 | -0.459 | 0.0034 | No | ||
| 74 | MKI67 | 3440750 4480072 7050288 | 15445 | -0.502 | 0.0029 | No | ||
| 75 | ADAM8 | 450347 5670609 | 15539 | -0.535 | 0.0059 | No | ||
| 76 | ASF1B | 6590706 | 16274 | -0.835 | -0.0212 | No | ||
| 77 | CENPK | 1740722 6200068 | 16451 | -0.917 | -0.0170 | No | ||
| 78 | GAS6 | 4480021 | 16954 | -1.166 | -0.0267 | No | ||
| 79 | RFC5 | 3800452 6020091 | 17085 | -1.251 | -0.0150 | No | ||
| 80 | TCF19 | 6200152 | 17380 | -1.449 | -0.0092 | No | ||
| 81 | TYMS | 940450 1940068 3710008 5570546 | 18328 | -2.473 | -0.0234 | No | ||
| 82 | DTYMK | 2340377 | 18381 | -2.603 | 0.0127 | No |

