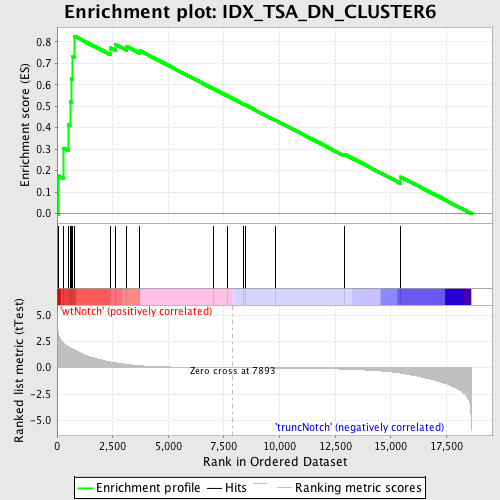
Profile of the Running ES Score & Positions of GeneSet Members on the Rank Ordered List
| Dataset | Set_03_truncNotch_versus_wtNotch.phenotype_truncNotch_versus_wtNotch.cls #wtNotch_versus_truncNotch.phenotype_truncNotch_versus_wtNotch.cls #wtNotch_versus_truncNotch_repos |
| Phenotype | phenotype_truncNotch_versus_wtNotch.cls#wtNotch_versus_truncNotch_repos |
| Upregulated in class | wtNotch |
| GeneSet | IDX_TSA_DN_CLUSTER6 |
| Enrichment Score (ES) | 0.8266087 |
| Normalized Enrichment Score (NES) | 1.832393 |
| Nominal p-value | 0.0 |
| FDR q-value | 0.06176144 |
| FWER p-Value | 0.102 |
| PROBE | DESCRIPTION (from dataset) | GENE SYMBOL | GENE_TITLE | RANK IN GENE LIST | RANK METRIC SCORE | RUNNING ES | CORE ENRICHMENT | |
|---|---|---|---|---|---|---|---|---|
| 1 | ARID1A | 2630022 1690551 4810110 | 78 | 2.995 | 0.1752 | Yes | ||
| 2 | CAPN7 | 5550050 | 286 | 2.361 | 0.3054 | Yes | ||
| 3 | ZNF638 | 6510112 | 494 | 1.998 | 0.4140 | Yes | ||
| 4 | SRPK2 | 6380341 | 580 | 1.872 | 0.5215 | Yes | ||
| 5 | ROCK1 | 130044 | 634 | 1.825 | 0.6280 | Yes | ||
| 6 | IREB2 | 1570202 2640114 | 677 | 1.775 | 0.7321 | Yes | ||
| 7 | MYEF2 | 6860484 | 779 | 1.669 | 0.8266 | Yes | ||
| 8 | ROD1 | 2060324 3140332 | 2408 | 0.541 | 0.7715 | No | ||
| 9 | HNRPM | 450497 4540451 | 2628 | 0.463 | 0.7874 | No | ||
| 10 | PHF12 | 870400 3130687 | 3125 | 0.306 | 0.7791 | No | ||
| 11 | CYP1B1 | 4760735 | 3724 | 0.185 | 0.7581 | No | ||
| 12 | PUM2 | 4200441 5910446 | 7013 | 0.015 | 0.5822 | No | ||
| 13 | SP3 | 3840338 | 7643 | 0.004 | 0.5486 | No | ||
| 14 | POLN | 5290524 | 8386 | -0.008 | 0.5092 | No | ||
| 15 | BUB1 | 5390270 | 8457 | -0.009 | 0.5059 | No | ||
| 16 | KIF2A | 3990286 6130575 | 9800 | -0.032 | 0.4357 | No | ||
| 17 | DNAJC3 | 5720301 | 12906 | -0.136 | 0.2769 | No | ||
| 18 | MKI67 | 3440750 4480072 7050288 | 15445 | -0.502 | 0.1705 | No |

