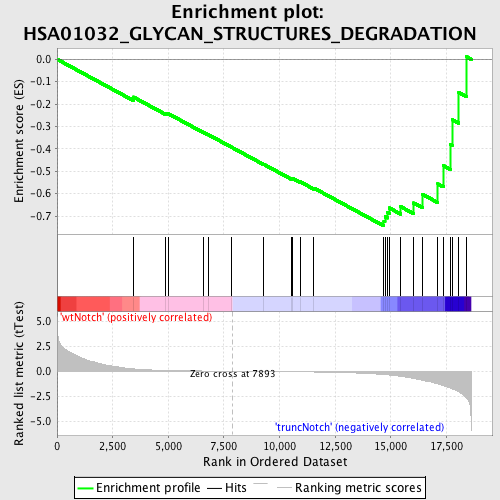
Profile of the Running ES Score & Positions of GeneSet Members on the Rank Ordered List
| Dataset | Set_03_truncNotch_versus_wtNotch.phenotype_truncNotch_versus_wtNotch.cls #wtNotch_versus_truncNotch.phenotype_truncNotch_versus_wtNotch.cls #wtNotch_versus_truncNotch_repos |
| Phenotype | phenotype_truncNotch_versus_wtNotch.cls#wtNotch_versus_truncNotch_repos |
| Upregulated in class | truncNotch |
| GeneSet | HSA01032_GLYCAN_STRUCTURES_DEGRADATION |
| Enrichment Score (ES) | -0.74430186 |
| Normalized Enrichment Score (NES) | -1.6099935 |
| Nominal p-value | 0.003539823 |
| FDR q-value | 0.15407433 |
| FWER p-Value | 0.966 |
| PROBE | DESCRIPTION (from dataset) | GENE SYMBOL | GENE_TITLE | RANK IN GENE LIST | RANK METRIC SCORE | RUNNING ES | CORE ENRICHMENT | |
|---|---|---|---|---|---|---|---|---|
| 1 | HPSE | 6660021 | 3425 | 0.240 | -0.1684 | No | ||
| 2 | MANBA | 3990537 | 4861 | 0.080 | -0.2403 | No | ||
| 3 | IDUA | 2690131 4060541 | 5016 | 0.072 | -0.2438 | No | ||
| 4 | HYAL1 | 3850341 | 6566 | 0.024 | -0.3256 | No | ||
| 5 | SPAM1 | 4480398 | 6790 | 0.019 | -0.3363 | No | ||
| 6 | HEXB | 5860692 | 7837 | 0.001 | -0.3925 | No | ||
| 7 | NEU4 | 430593 510113 2450279 | 9284 | -0.023 | -0.4687 | No | ||
| 8 | FUCA1 | 610075 | 10520 | -0.047 | -0.5321 | No | ||
| 9 | NEU2 | 6510711 | 10573 | -0.048 | -0.5317 | No | ||
| 10 | IDS | 360619 5720161 | 10917 | -0.056 | -0.5464 | No | ||
| 11 | AGA | 6350292 | 11537 | -0.074 | -0.5748 | No | ||
| 12 | GBA | 2640301 | 14689 | -0.333 | -0.7223 | Yes | ||
| 13 | GLB1 | 6840673 | 14739 | -0.343 | -0.7023 | Yes | ||
| 14 | MAN2B1 | 4210446 | 14861 | -0.362 | -0.6849 | Yes | ||
| 15 | ARSB | 3190093 5360491 | 14931 | -0.377 | -0.6638 | Yes | ||
| 16 | HYAL2 | 1500152 | 15446 | -0.502 | -0.6583 | Yes | ||
| 17 | GNS | 3120458 | 16028 | -0.726 | -0.6416 | Yes | ||
| 18 | HEXA | 2630358 | 16426 | -0.905 | -0.6032 | Yes | ||
| 19 | NAGLU | 610095 | 17114 | -1.266 | -0.5565 | Yes | ||
| 20 | NEU1 | 380546 | 17368 | -1.439 | -0.4752 | Yes | ||
| 21 | GALNS | 1850537 | 17683 | -1.689 | -0.3806 | Yes | ||
| 22 | MAN2B2 | 3120706 | 17758 | -1.747 | -0.2693 | Yes | ||
| 23 | NEU3 | 3710270 | 18056 | -2.064 | -0.1490 | Yes | ||
| 24 | MAN2C1 | 6770064 | 18414 | -2.713 | 0.0109 | Yes |

