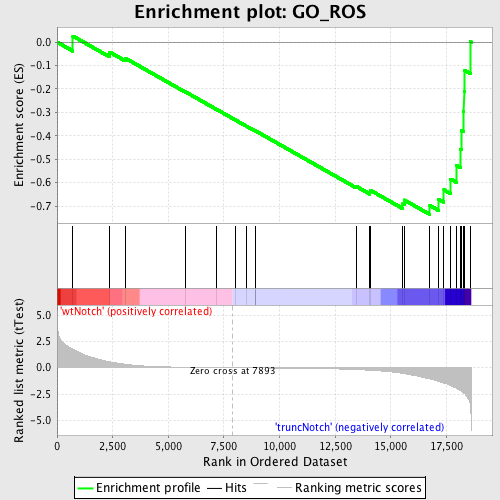
Profile of the Running ES Score & Positions of GeneSet Members on the Rank Ordered List
| Dataset | Set_03_truncNotch_versus_wtNotch.phenotype_truncNotch_versus_wtNotch.cls #wtNotch_versus_truncNotch.phenotype_truncNotch_versus_wtNotch.cls #wtNotch_versus_truncNotch_repos |
| Phenotype | phenotype_truncNotch_versus_wtNotch.cls#wtNotch_versus_truncNotch_repos |
| Upregulated in class | truncNotch |
| GeneSet | GO_ROS |
| Enrichment Score (ES) | -0.7356111 |
| Normalized Enrichment Score (NES) | -1.635061 |
| Nominal p-value | 0.0016778524 |
| FDR q-value | 0.18237391 |
| FWER p-Value | 0.895 |
| PROBE | DESCRIPTION (from dataset) | GENE SYMBOL | GENE_TITLE | RANK IN GENE LIST | RANK METRIC SCORE | RUNNING ES | CORE ENRICHMENT | |
|---|---|---|---|---|---|---|---|---|
| 1 | OSR1 | 1500025 | 710 | 1.738 | 0.0257 | No | ||
| 2 | SOD2 | 1410053 | 2354 | 0.560 | -0.0421 | No | ||
| 3 | RPS6KA5 | 2120563 7040546 | 3063 | 0.322 | -0.0683 | No | ||
| 4 | ATOX1 | 1090497 | 5765 | 0.043 | -0.2120 | No | ||
| 5 | SGK2 | 1850070 | 7156 | 0.012 | -0.2863 | No | ||
| 6 | NCF1 | 3850091 | 8001 | -0.002 | -0.3317 | No | ||
| 7 | CCS | 3450524 | 8527 | -0.010 | -0.3595 | No | ||
| 8 | AOX1 | 110082 6290450 | 8902 | -0.016 | -0.3790 | No | ||
| 9 | SEPP1 | 450273 | 8914 | -0.017 | -0.3790 | No | ||
| 10 | NCF2 | 540129 2370441 2650133 | 8928 | -0.017 | -0.3791 | No | ||
| 11 | MSRA | 4570411 | 13434 | -0.175 | -0.6150 | No | ||
| 12 | SOD1 | 5890070 | 14062 | -0.237 | -0.6400 | No | ||
| 13 | FOXM1 | 6650402 6980091 | 14066 | -0.238 | -0.6314 | No | ||
| 14 | NUDT1 | 2850600 | 15534 | -0.534 | -0.6907 | No | ||
| 15 | LTC4S | 2570411 | 15603 | -0.561 | -0.6738 | No | ||
| 16 | MPO | 2360176 2760440 5690176 | 16754 | -1.045 | -0.6972 | Yes | ||
| 17 | GSS | 6130465 6900398 | 17138 | -1.284 | -0.6706 | Yes | ||
| 18 | CCL5 | 3710397 | 17387 | -1.453 | -0.6305 | Yes | ||
| 19 | MTL5 | 6940300 | 17694 | -1.694 | -0.5847 | Yes | ||
| 20 | PRDX2 | 6760095 4010619 5340577 | 17956 | -1.957 | -0.5268 | Yes | ||
| 21 | CYBA | 4760739 | 18125 | -2.152 | -0.4567 | Yes | ||
| 22 | PDLIM1 | 450100 | 18182 | -2.210 | -0.3785 | Yes | ||
| 23 | GPX3 | 1340450 | 18260 | -2.360 | -0.2959 | Yes | ||
| 24 | SCARA3 | 5890487 | 18289 | -2.403 | -0.2091 | Yes | ||
| 25 | STK25 | 1090519 1500193 | 18311 | -2.438 | -0.1206 | Yes | ||
| 26 | DUSP1 | 6860121 | 18587 | -3.727 | 0.0016 | Yes |

