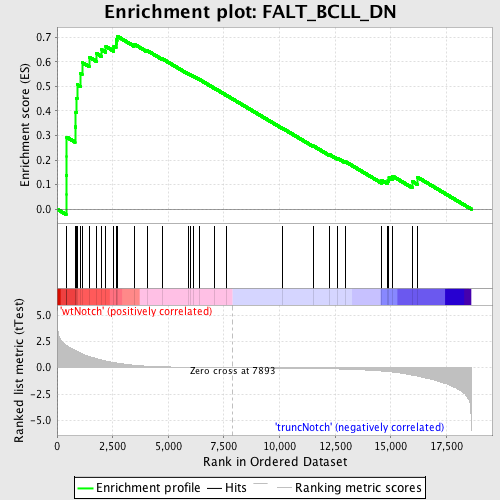
Profile of the Running ES Score & Positions of GeneSet Members on the Rank Ordered List
| Dataset | Set_03_truncNotch_versus_wtNotch.phenotype_truncNotch_versus_wtNotch.cls #wtNotch_versus_truncNotch.phenotype_truncNotch_versus_wtNotch.cls #wtNotch_versus_truncNotch_repos |
| Phenotype | phenotype_truncNotch_versus_wtNotch.cls#wtNotch_versus_truncNotch_repos |
| Upregulated in class | wtNotch |
| GeneSet | FALT_BCLL_DN |
| Enrichment Score (ES) | 0.7043266 |
| Normalized Enrichment Score (NES) | 1.7769948 |
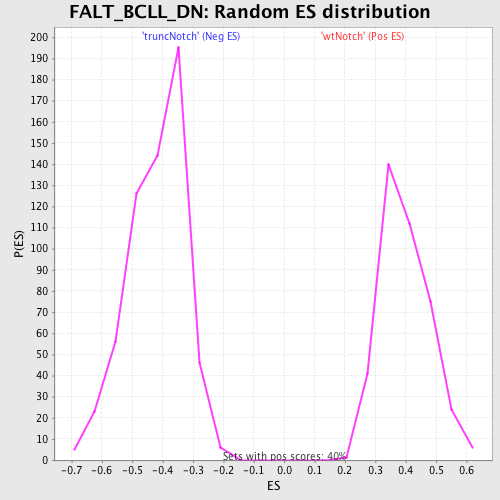
| Nominal p-value | 0.0 |
| FDR q-value | 0.042392664 |
| FWER p-Value | 0.284 |
| PROBE | DESCRIPTION (from dataset) | GENE SYMBOL | GENE_TITLE | RANK IN GENE LIST | RANK METRIC SCORE | RUNNING ES | CORE ENRICHMENT | |
|---|---|---|---|---|---|---|---|---|
| 1 | YWHAB | 1740176 | 404 | 2.133 | 0.0584 | Yes | ||
| 2 | POP4 | 4560600 | 406 | 2.122 | 0.1380 | Yes | ||
| 3 | DDX1 | 3450047 | 435 | 2.082 | 0.2147 | Yes | ||
| 4 | SMC5 | 3440164 | 437 | 2.080 | 0.2928 | Yes | ||
| 5 | SMAD2 | 4200592 | 806 | 1.643 | 0.3347 | Yes | ||
| 6 | PSMD10 | 520494 1170576 3830050 | 842 | 1.611 | 0.3933 | Yes | ||
| 7 | ACBD3 | 2760170 | 878 | 1.570 | 0.4504 | Yes | ||
| 8 | NPC2 | 2350102 | 899 | 1.546 | 0.5074 | Yes | ||
| 9 | ING1 | 5690010 6520056 | 1048 | 1.388 | 0.5516 | Yes | ||
| 10 | MAP3K7IP2 | 2340242 | 1123 | 1.315 | 0.5970 | Yes | ||
| 11 | CBX7 | 3940035 | 1441 | 1.042 | 0.6191 | Yes | ||
| 12 | TBL1X | 6400524 | 1777 | 0.858 | 0.6333 | Yes | ||
| 13 | CCNG2 | 3190095 | 1989 | 0.734 | 0.6495 | Yes | ||
| 14 | PUM1 | 6130500 | 2191 | 0.627 | 0.6622 | Yes | ||
| 15 | TSPO | 110692 3390452 | 2551 | 0.488 | 0.6612 | Yes | ||
| 16 | NDUFC1 | 2570377 4200239 | 2649 | 0.457 | 0.6732 | Yes | ||
| 17 | ASAH1 | 510152 1340484 1740707 | 2669 | 0.450 | 0.6890 | Yes | ||
| 18 | SNW1 | 4010736 | 2694 | 0.442 | 0.7043 | Yes | ||
| 19 | SAP18 | 3610092 | 3458 | 0.232 | 0.6720 | No | ||
| 20 | CDKN1B | 3800025 6450044 | 4044 | 0.142 | 0.6458 | No | ||
| 21 | PBX3 | 1300424 3710577 6180575 | 4737 | 0.086 | 0.6118 | No | ||
| 22 | MOAP1 | 580537 | 5905 | 0.039 | 0.5505 | No | ||
| 23 | SPEN | 2060041 | 5991 | 0.037 | 0.5473 | No | ||
| 24 | PLCL2 | 6100575 | 6122 | 0.034 | 0.5416 | No | ||
| 25 | HEBP2 | 1990309 | 6413 | 0.027 | 0.5270 | No | ||
| 26 | CTDSP2 | 5340315 5690133 | 7057 | 0.014 | 0.4929 | No | ||
| 27 | PSMD8 | 630142 | 7603 | 0.005 | 0.4637 | No | ||
| 28 | ADARB1 | 780451 | 10135 | -0.039 | 0.3290 | No | ||
| 29 | RNF13 | 2370021 | 11518 | -0.073 | 0.2573 | No | ||
| 30 | LMO4 | 3800746 | 12260 | -0.101 | 0.2213 | No | ||
| 31 | RABGAP1L | 3190014 6860088 | 12620 | -0.120 | 0.2064 | No | ||
| 32 | PLP2 | 2100167 | 12945 | -0.138 | 0.1942 | No | ||
| 33 | TBCC | 4810021 | 14588 | -0.315 | 0.1176 | No | ||
| 34 | MXI1 | 5050064 5130484 | 14871 | -0.363 | 0.1161 | No | ||
| 35 | MKRN1 | 1410097 | 14917 | -0.374 | 0.1277 | No | ||
| 36 | FCGR2B | 780750 | 15081 | -0.410 | 0.1344 | No | ||
| 37 | COX7A2 | 4280114 | 15959 | -0.694 | 0.1132 | No | ||
| 38 | SCRN1 | 6040025 6580019 | 16188 | -0.791 | 0.1307 | No |