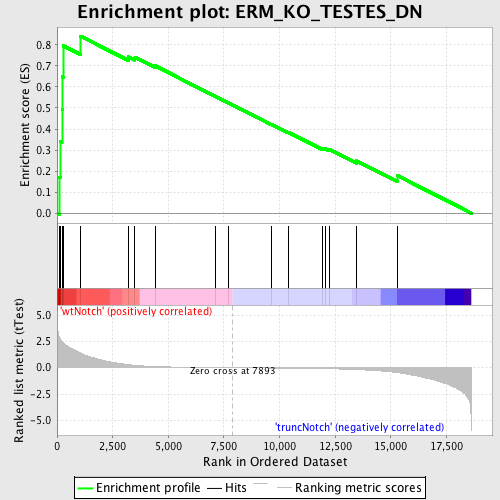
Profile of the Running ES Score & Positions of GeneSet Members on the Rank Ordered List
| Dataset | Set_03_truncNotch_versus_wtNotch.phenotype_truncNotch_versus_wtNotch.cls #wtNotch_versus_truncNotch.phenotype_truncNotch_versus_wtNotch.cls #wtNotch_versus_truncNotch_repos |
| Phenotype | phenotype_truncNotch_versus_wtNotch.cls#wtNotch_versus_truncNotch_repos |
| Upregulated in class | wtNotch |
| GeneSet | ERM_KO_TESTES_DN |
| Enrichment Score (ES) | 0.84164727 |
| Normalized Enrichment Score (NES) | 1.808685 |
| Nominal p-value | 0.0023696683 |
| FDR q-value | 0.05227059 |
| FWER p-Value | 0.164 |
| PROBE | DESCRIPTION (from dataset) | GENE SYMBOL | GENE_TITLE | RANK IN GENE LIST | RANK METRIC SCORE | RUNNING ES | CORE ENRICHMENT | |
|---|---|---|---|---|---|---|---|---|
| 1 | CDCA7 | 3060097 | 116 | 2.812 | 0.1707 | Yes | ||
| 2 | NFYB | 1850053 | 138 | 2.739 | 0.3418 | Yes | ||
| 3 | RBL1 | 3130372 | 220 | 2.502 | 0.4949 | Yes | ||
| 4 | DCK | 6900411 | 241 | 2.451 | 0.6480 | Yes | ||
| 5 | MAD2L1 | 4480725 | 273 | 2.379 | 0.7960 | Yes | ||
| 6 | CCNE2 | 3120537 | 1049 | 1.388 | 0.8416 | Yes | ||
| 7 | CDK2 | 130484 2260301 4010088 5050110 | 3216 | 0.284 | 0.7430 | No | ||
| 8 | RAD51 | 6110450 6980280 | 3499 | 0.225 | 0.7420 | No | ||
| 9 | TGFBR1 | 1400148 4280020 6550711 | 4403 | 0.109 | 0.7003 | No | ||
| 10 | DDX10 | 520746 | 7130 | 0.013 | 0.5546 | No | ||
| 11 | DAZL | 4050082 | 7682 | 0.004 | 0.5252 | No | ||
| 12 | HELLS | 4560086 4810025 | 9648 | -0.029 | 0.4213 | No | ||
| 13 | CRABP1 | 450278 | 10394 | -0.044 | 0.3841 | No | ||
| 14 | TKTL1 | 2810672 6760102 | 11943 | -0.088 | 0.3064 | No | ||
| 15 | DMC1 | 450341 | 12054 | -0.092 | 0.3063 | No | ||
| 16 | SOX3 | 4570537 | 12246 | -0.101 | 0.3024 | No | ||
| 17 | RBMY1A1 | 6200053 | 13460 | -0.177 | 0.2483 | No | ||
| 18 | MCM2 | 5050139 | 15297 | -0.459 | 0.1785 | No |

