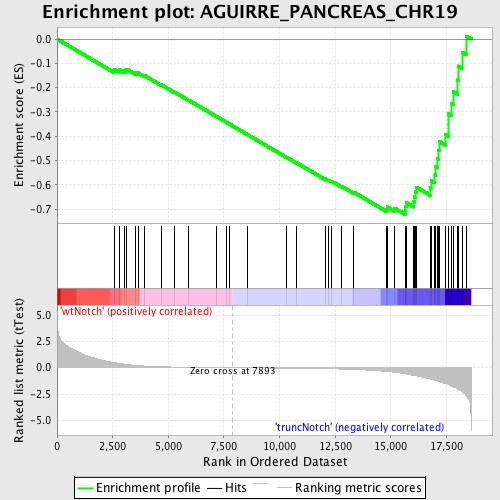
Profile of the Running ES Score & Positions of GeneSet Members on the Rank Ordered List
| Dataset | Set_03_truncNotch_versus_wtNotch.phenotype_truncNotch_versus_wtNotch.cls #wtNotch_versus_truncNotch.phenotype_truncNotch_versus_wtNotch.cls #wtNotch_versus_truncNotch_repos |
| Phenotype | phenotype_truncNotch_versus_wtNotch.cls#wtNotch_versus_truncNotch_repos |
| Upregulated in class | truncNotch |
| GeneSet | AGUIRRE_PANCREAS_CHR19 |
| Enrichment Score (ES) | -0.7215732 |
| Normalized Enrichment Score (NES) | -1.7916049 |
| Nominal p-value | 0.0 |
| FDR q-value | 0.016340898 |
| FWER p-Value | 0.053 |
| PROBE | DESCRIPTION (from dataset) | GENE SYMBOL | GENE_TITLE | RANK IN GENE LIST | RANK METRIC SCORE | RUNNING ES | CORE ENRICHMENT | |
|---|---|---|---|---|---|---|---|---|
| 1 | U2AF2 | 450600 4670128 5420292 | 2584 | 0.476 | -0.1253 | No | ||
| 2 | PPP5C | 3130047 | 2795 | 0.409 | -0.1247 | No | ||
| 3 | DPF1 | 3840435 4540041 | 3026 | 0.332 | -0.1275 | No | ||
| 4 | HNRPL | 4210593 | 3121 | 0.307 | -0.1236 | No | ||
| 5 | CNOT3 | 130519 4480292 1990609 | 3530 | 0.217 | -0.1393 | No | ||
| 6 | LENG4 | 2060400 5700487 | 3639 | 0.199 | -0.1393 | No | ||
| 7 | DBP | 4200270 | 3917 | 0.157 | -0.1497 | No | ||
| 8 | FBXO17 | 6020072 | 4693 | 0.090 | -0.1888 | No | ||
| 9 | PRPF31 | 6100360 | 5266 | 0.061 | -0.2178 | No | ||
| 10 | LHB | 1450368 | 5917 | 0.039 | -0.2517 | No | ||
| 11 | EHD2 | 6040044 | 7158 | 0.012 | -0.3181 | No | ||
| 12 | PSMD8 | 630142 | 7603 | 0.005 | -0.3419 | No | ||
| 13 | C5AR1 | 4540402 | 7746 | 0.002 | -0.3495 | No | ||
| 14 | NCR1 | 2450026 | 8558 | -0.011 | -0.3928 | No | ||
| 15 | GYS1 | 540154 | 10310 | -0.042 | -0.4859 | No | ||
| 16 | FUT1 | 1500068 | 10770 | -0.053 | -0.5091 | No | ||
| 17 | EML2 | 4060411 | 12046 | -0.092 | -0.5750 | No | ||
| 18 | KDELR1 | 6760504 | 12200 | -0.099 | -0.5804 | No | ||
| 19 | SYT5 | 4150082 | 12325 | -0.105 | -0.5840 | No | ||
| 20 | RPL18 | 6380181 3870195 | 12789 | -0.129 | -0.6052 | No | ||
| 21 | IRF3 | 3290601 5860154 6180162 | 13342 | -0.167 | -0.6301 | No | ||
| 22 | RPL13A | 2680519 5700142 | 14818 | -0.353 | -0.6993 | No | ||
| 23 | SNRP70 | 4200181 | 14833 | -0.355 | -0.6897 | No | ||
| 24 | RCN3 | 5420400 | 15173 | -0.429 | -0.6955 | No | ||
| 25 | MRPS12 | 4210707 6110341 | 15658 | -0.579 | -0.7047 | Yes | ||
| 26 | SLC1A5 | 670133 3140020 | 15668 | -0.584 | -0.6883 | Yes | ||
| 27 | PPP1R13L | 5220202 | 15698 | -0.592 | -0.6726 | Yes | ||
| 28 | PAK4 | 1690152 | 16038 | -0.731 | -0.6696 | Yes | ||
| 29 | NFKBIB | 2260167 | 16064 | -0.743 | -0.6494 | Yes | ||
| 30 | LIG1 | 1980438 4540112 5570609 | 16090 | -0.754 | -0.6288 | Yes | ||
| 31 | NOSIP | 6290671 6380064 | 16158 | -0.779 | -0.6098 | Yes | ||
| 32 | PRMT1 | 2850050 | 16773 | -1.059 | -0.6121 | Yes | ||
| 33 | PLEKHA4 | 4230372 | 16811 | -1.076 | -0.5829 | Yes | ||
| 34 | RUVBL2 | 1190377 | 16984 | -1.182 | -0.5578 | Yes | ||
| 35 | EPN1 | 4060725 | 17026 | -1.211 | -0.5248 | Yes | ||
| 36 | STRN4 | 3440711 | 17088 | -1.254 | -0.4917 | Yes | ||
| 37 | SIRT2 | 630494 | 17129 | -1.273 | -0.4569 | Yes | ||
| 38 | SARS2 | 3190390 | 17170 | -1.314 | -0.4209 | Yes | ||
| 39 | NUCB1 | 110736 4780131 | 17458 | -1.493 | -0.3929 | Yes | ||
| 40 | NUP62 | 1240128 | 17585 | -1.591 | -0.3535 | Yes | ||
| 41 | NR1H2 | 4070056 | 17586 | -1.592 | -0.3073 | Yes | ||
| 42 | TSEN34 | 1450465 | 17743 | -1.735 | -0.2653 | Yes | ||
| 43 | MAP4K1 | 4060692 | 17806 | -1.804 | -0.2162 | Yes | ||
| 44 | GRWD1 | 6350528 | 17999 | -2.004 | -0.1683 | Yes | ||
| 45 | SNRPD2 | 6110035 | 18030 | -2.033 | -0.1109 | Yes | ||
| 46 | BAX | 3830008 | 18200 | -2.252 | -0.0546 | Yes | ||
| 47 | NAPA | 1780537 5720102 | 18394 | -2.648 | 0.0120 | Yes |

