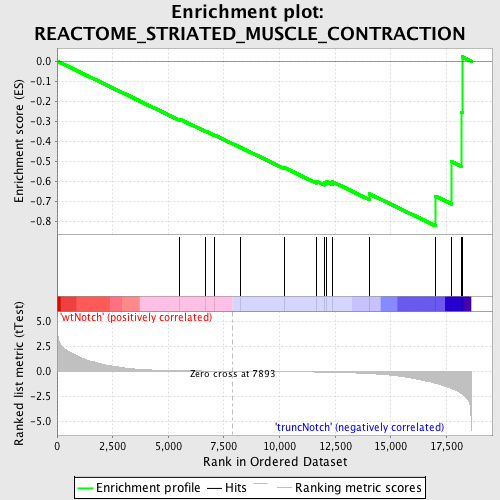
Profile of the Running ES Score & Positions of GeneSet Members on the Rank Ordered List
| Dataset | Set_03_truncNotch_versus_wtNotch.phenotype_truncNotch_versus_wtNotch.cls #wtNotch_versus_truncNotch.phenotype_truncNotch_versus_wtNotch.cls #wtNotch_versus_truncNotch_repos |
| Phenotype | phenotype_truncNotch_versus_wtNotch.cls#wtNotch_versus_truncNotch_repos |
| Upregulated in class | truncNotch |
| GeneSet | REACTOME_STRIATED_MUSCLE_CONTRACTION |
| Enrichment Score (ES) | -0.8240395 |
| Normalized Enrichment Score (NES) | -1.6077992 |
| Nominal p-value | 0.0071301246 |
| FDR q-value | 0.30757964 |
| FWER p-Value | 0.82 |
| PROBE | DESCRIPTION (from dataset) | GENE SYMBOL | GENE_TITLE | RANK IN GENE LIST | RANK METRIC SCORE | RUNNING ES | CORE ENRICHMENT | |
|---|---|---|---|---|---|---|---|---|
| 1 | TNNT2 | 2450364 | 5502 | 0.052 | -0.2894 | No | ||
| 2 | NEB | 580735 | 6684 | 0.021 | -0.3503 | No | ||
| 3 | MYL3 | 6040563 | 7079 | 0.013 | -0.3698 | No | ||
| 4 | MYBPC2 | 1980368 | 8229 | -0.005 | -0.4309 | No | ||
| 5 | DES | 1450341 | 10230 | -0.041 | -0.5334 | No | ||
| 6 | TNNC1 | 1990575 | 11645 | -0.077 | -0.6000 | No | ||
| 7 | MYH6 | 2900373 | 12005 | -0.091 | -0.6082 | No | ||
| 8 | TMOD1 | 3850100 | 12119 | -0.095 | -0.6026 | No | ||
| 9 | DMD | 1740041 3990332 | 12380 | -0.107 | -0.6035 | No | ||
| 10 | VIM | 20431 | 14039 | -0.235 | -0.6638 | No | ||
| 11 | TNNI3 | 7000093 | 17021 | -1.209 | -0.6761 | Yes | ||
| 12 | TPM1 | 130673 | 17733 | -1.728 | -0.5030 | Yes | ||
| 13 | TCAP | 4890446 | 18185 | -2.223 | -0.2553 | Yes | ||
| 14 | ACTN2 | 4200435 | 18217 | -2.276 | 0.0214 | Yes |

