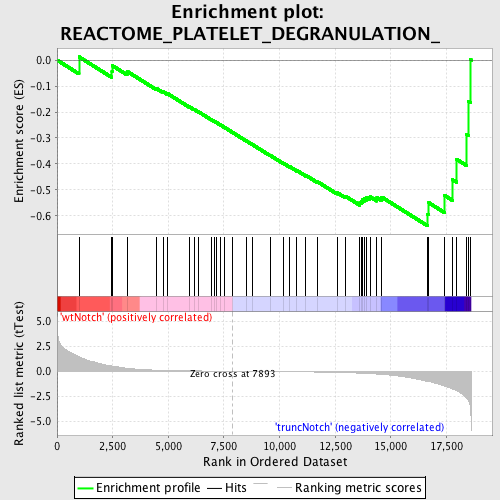
Profile of the Running ES Score & Positions of GeneSet Members on the Rank Ordered List
| Dataset | Set_03_truncNotch_versus_wtNotch.phenotype_truncNotch_versus_wtNotch.cls #wtNotch_versus_truncNotch.phenotype_truncNotch_versus_wtNotch.cls #wtNotch_versus_truncNotch_repos |
| Phenotype | phenotype_truncNotch_versus_wtNotch.cls#wtNotch_versus_truncNotch_repos |
| Upregulated in class | truncNotch |
| GeneSet | REACTOME_PLATELET_DEGRANULATION_ |
| Enrichment Score (ES) | -0.63920796 |
| Normalized Enrichment Score (NES) | -1.5532155 |
| Nominal p-value | 0.004854369 |
| FDR q-value | 0.42500216 |
| FWER p-Value | 0.986 |
| PROBE | DESCRIPTION (from dataset) | GENE SYMBOL | GENE_TITLE | RANK IN GENE LIST | RANK METRIC SCORE | RUNNING ES | CORE ENRICHMENT | |
|---|---|---|---|---|---|---|---|---|
| 1 | LAMP2 | 1230402 1980373 | 984 | 1.449 | 0.0127 | No | ||
| 2 | FN1 | 1170601 2970647 6220288 6940037 | 2465 | 0.517 | -0.0435 | No | ||
| 3 | EGF | 5220154 | 2474 | 0.515 | -0.0206 | No | ||
| 4 | SERPINF2 | 2470390 2690292 | 3147 | 0.299 | -0.0433 | No | ||
| 5 | FGG | 4610717 | 4467 | 0.104 | -0.1095 | No | ||
| 6 | SPARC | 1690086 | 4765 | 0.085 | -0.1217 | No | ||
| 7 | HGF | 3360593 | 4957 | 0.075 | -0.1285 | No | ||
| 8 | THBS1 | 4560494 430288 | 5939 | 0.039 | -0.1796 | No | ||
| 9 | FGB | 7000010 | 6157 | 0.033 | -0.1898 | No | ||
| 10 | VWF | 4670519 | 6359 | 0.028 | -0.1993 | No | ||
| 11 | LEFTY2 | 5670364 | 6922 | 0.017 | -0.2288 | No | ||
| 12 | HRG | 2340161 | 7074 | 0.014 | -0.2364 | No | ||
| 13 | PROS1 | 5420465 | 7172 | 0.012 | -0.2410 | No | ||
| 14 | GP5 | 2510088 | 7336 | 0.009 | -0.2494 | No | ||
| 15 | CD36 | 5890575 | 7533 | 0.006 | -0.2597 | No | ||
| 16 | A2M | 6620039 | 7900 | -0.000 | -0.2794 | No | ||
| 17 | ITGA2B | 2680538 | 8507 | -0.010 | -0.3116 | No | ||
| 18 | TMSB4X | 6620114 | 8778 | -0.014 | -0.3254 | No | ||
| 19 | F8 | 2190647 2340465 | 9575 | -0.028 | -0.3670 | No | ||
| 20 | GP1BB | 3780075 | 10194 | -0.040 | -0.3985 | No | ||
| 21 | GP1BA | 6590372 | 10453 | -0.046 | -0.4103 | No | ||
| 22 | PLG | 3360270 3840100 | 10781 | -0.053 | -0.4255 | No | ||
| 23 | GP9 | 1190181 | 11185 | -0.063 | -0.4443 | No | ||
| 24 | F5 | 1990619 | 11694 | -0.079 | -0.4681 | No | ||
| 25 | KNG1 | 6400576 6770347 | 12586 | -0.118 | -0.5107 | No | ||
| 26 | CFD | 2320736 | 12965 | -0.140 | -0.5247 | No | ||
| 27 | PPBP | 5130446 | 13605 | -0.191 | -0.5505 | No | ||
| 28 | ITGB3 | 5270463 | 13680 | -0.198 | -0.5455 | No | ||
| 29 | MMRN1 | 7050278 | 13721 | -0.202 | -0.5385 | No | ||
| 30 | FGA | 4210056 5220239 | 13810 | -0.211 | -0.5337 | No | ||
| 31 | SERPINE1 | 4210403 | 13918 | -0.222 | -0.5294 | No | ||
| 32 | SELP | 6040193 | 14063 | -0.237 | -0.5264 | No | ||
| 33 | APP | 2510053 | 14374 | -0.278 | -0.5305 | No | ||
| 34 | IGF1 | 1990193 3130377 3290280 | 14585 | -0.315 | -0.5276 | No | ||
| 35 | CD9 | 4730041 | 16660 | -1.005 | -0.5937 | Yes | ||
| 36 | PF4 | 6130332 | 16706 | -1.023 | -0.5497 | Yes | ||
| 37 | TIMP1 | 1010326 | 17404 | -1.464 | -0.5209 | Yes | ||
| 38 | SERPING1 | 5550440 | 17774 | -1.761 | -0.4610 | Yes | ||
| 39 | CD63 | 6660451 | 17955 | -1.956 | -0.3820 | Yes | ||
| 40 | CLU | 5420075 | 18405 | -2.667 | -0.2853 | Yes | ||
| 41 | ALDOA | 6290672 | 18479 | -2.907 | -0.1575 | Yes | ||
| 42 | ACTN4 | 3840301 4590390 7050132 | 18583 | -3.637 | 0.0018 | Yes |

