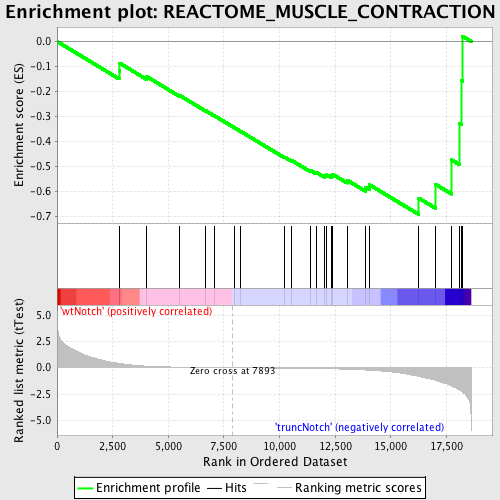
Profile of the Running ES Score & Positions of GeneSet Members on the Rank Ordered List
| Dataset | Set_03_truncNotch_versus_wtNotch.phenotype_truncNotch_versus_wtNotch.cls #wtNotch_versus_truncNotch.phenotype_truncNotch_versus_wtNotch.cls #wtNotch_versus_truncNotch_repos |
| Phenotype | phenotype_truncNotch_versus_wtNotch.cls#wtNotch_versus_truncNotch_repos |
| Upregulated in class | truncNotch |
| GeneSet | REACTOME_MUSCLE_CONTRACTION |
| Enrichment Score (ES) | -0.69267666 |
| Normalized Enrichment Score (NES) | -1.5337692 |
| Nominal p-value | 0.008865248 |
| FDR q-value | 0.35082448 |
| FWER p-Value | 0.998 |
| PROBE | DESCRIPTION (from dataset) | GENE SYMBOL | GENE_TITLE | RANK IN GENE LIST | RANK METRIC SCORE | RUNNING ES | CORE ENRICHMENT | |
|---|---|---|---|---|---|---|---|---|
| 1 | PXN | 3290048 6400132 | 2787 | 0.410 | -0.1175 | No | ||
| 2 | VCL | 4120487 | 2812 | 0.405 | -0.0868 | No | ||
| 3 | SORBS3 | 50465 | 4009 | 0.147 | -0.1395 | No | ||
| 4 | TNNT2 | 2450364 | 5502 | 0.052 | -0.2156 | No | ||
| 5 | NEB | 580735 | 6684 | 0.021 | -0.2774 | No | ||
| 6 | MYL3 | 6040563 | 7079 | 0.013 | -0.2976 | No | ||
| 7 | MYH11 | 7100273 | 7968 | -0.001 | -0.3452 | No | ||
| 8 | MYBPC2 | 1980368 | 8229 | -0.005 | -0.3588 | No | ||
| 9 | DES | 1450341 | 10230 | -0.041 | -0.4632 | No | ||
| 10 | LMOD1 | 2120035 | 10544 | -0.047 | -0.4762 | No | ||
| 11 | CALD1 | 1770129 1940397 | 11403 | -0.070 | -0.5169 | No | ||
| 12 | TNNC1 | 1990575 | 11645 | -0.077 | -0.5237 | No | ||
| 13 | MYH6 | 2900373 | 12005 | -0.091 | -0.5358 | No | ||
| 14 | TMOD1 | 3850100 | 12119 | -0.095 | -0.5344 | No | ||
| 15 | CALM1 | 380128 | 12341 | -0.106 | -0.5379 | No | ||
| 16 | DMD | 1740041 3990332 | 12380 | -0.107 | -0.5315 | No | ||
| 17 | MYLK | 4010600 7000364 | 13035 | -0.144 | -0.5552 | No | ||
| 18 | ACTG2 | 4780180 | 13871 | -0.217 | -0.5830 | No | ||
| 19 | VIM | 20431 | 14039 | -0.235 | -0.5734 | No | ||
| 20 | ITGB5 | 70129 | 16258 | -0.828 | -0.6272 | Yes | ||
| 21 | TNNI3 | 7000093 | 17021 | -1.209 | -0.5725 | Yes | ||
| 22 | TPM1 | 130673 | 17733 | -1.728 | -0.4741 | Yes | ||
| 23 | MYL6 | 60563 6100152 | 18078 | -2.094 | -0.3270 | Yes | ||
| 24 | TCAP | 4890446 | 18185 | -2.223 | -0.1569 | Yes | ||
| 25 | ACTN2 | 4200435 | 18217 | -2.276 | 0.0215 | Yes |

