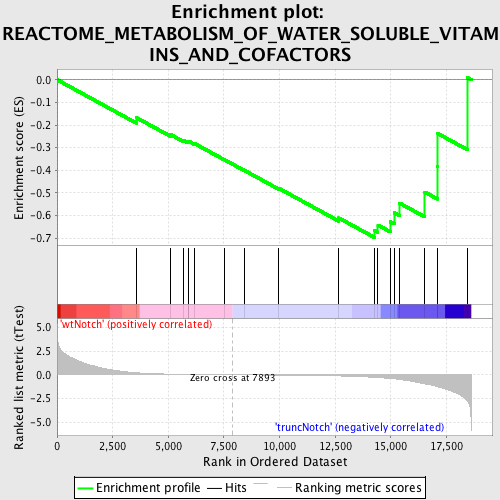
Profile of the Running ES Score & Positions of GeneSet Members on the Rank Ordered List
| Dataset | Set_03_truncNotch_versus_wtNotch.phenotype_truncNotch_versus_wtNotch.cls #wtNotch_versus_truncNotch.phenotype_truncNotch_versus_wtNotch.cls #wtNotch_versus_truncNotch_repos |
| Phenotype | phenotype_truncNotch_versus_wtNotch.cls#wtNotch_versus_truncNotch_repos |
| Upregulated in class | truncNotch |
| GeneSet | REACTOME_METABOLISM_OF_WATER_SOLUBLE_VITAMINS_AND_COFACTORS |
| Enrichment Score (ES) | -0.69633687 |
| Normalized Enrichment Score (NES) | -1.462993 |
| Nominal p-value | 0.030927835 |
| FDR q-value | 0.56228167 |
| FWER p-Value | 1.0 |
| PROBE | DESCRIPTION (from dataset) | GENE SYMBOL | GENE_TITLE | RANK IN GENE LIST | RANK METRIC SCORE | RUNNING ES | CORE ENRICHMENT | |
|---|---|---|---|---|---|---|---|---|
| 1 | FASN | 430717 | 3556 | 0.211 | -0.1669 | No | ||
| 2 | DHFR | 6350315 | 5099 | 0.069 | -0.2420 | No | ||
| 3 | KMO | 7000132 | 5698 | 0.045 | -0.2689 | No | ||
| 4 | MTHFR | 7100253 | 5887 | 0.040 | -0.2745 | No | ||
| 5 | KYNU | 1410435 | 5902 | 0.039 | -0.2707 | No | ||
| 6 | AFMID | 1500398 1770093 1990315 3440056 3520500 6400075 | 6152 | 0.033 | -0.2803 | No | ||
| 7 | TDO2 | 6110048 | 7515 | 0.006 | -0.3528 | No | ||
| 8 | SLC25A16 | 4200341 | 8431 | -0.009 | -0.4010 | No | ||
| 9 | MTHFD1 | 5900398 6520427 | 9960 | -0.036 | -0.4791 | No | ||
| 10 | CYB5R3 | 430097 6860400 | 12660 | -0.121 | -0.6103 | No | ||
| 11 | HAAO | 430369 450113 | 14262 | -0.265 | -0.6659 | Yes | ||
| 12 | CYB5A | 5080450 | 14422 | -0.285 | -0.6418 | Yes | ||
| 13 | QPRT | 670270 | 14982 | -0.388 | -0.6272 | Yes | ||
| 14 | ENPP1 | 780609 | 15159 | -0.426 | -0.5877 | Yes | ||
| 15 | ACP5 | 2230717 | 15383 | -0.483 | -0.5442 | Yes | ||
| 16 | SLC19A1 | 6770139 | 16531 | -0.954 | -0.4962 | Yes | ||
| 17 | SLC2A3 | 1990377 | 17099 | -1.258 | -0.3822 | Yes | ||
| 18 | SHMT1 | 5900132 | 17112 | -1.264 | -0.2375 | Yes | ||
| 19 | COASY | 6220707 | 18438 | -2.771 | 0.0096 | Yes |

