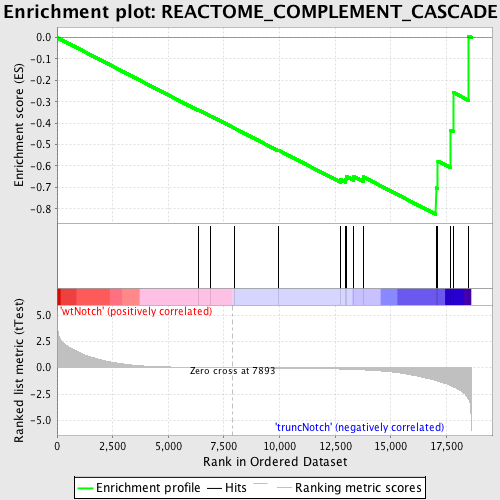
Profile of the Running ES Score & Positions of GeneSet Members on the Rank Ordered List
| Dataset | Set_03_truncNotch_versus_wtNotch.phenotype_truncNotch_versus_wtNotch.cls #wtNotch_versus_truncNotch.phenotype_truncNotch_versus_wtNotch.cls #wtNotch_versus_truncNotch_repos |
| Phenotype | phenotype_truncNotch_versus_wtNotch.cls#wtNotch_versus_truncNotch_repos |
| Upregulated in class | truncNotch |
| GeneSet | REACTOME_COMPLEMENT_CASCADE |
| Enrichment Score (ES) | -0.8266393 |
| Normalized Enrichment Score (NES) | -1.6121956 |
| Nominal p-value | 0.0017699115 |
| FDR q-value | 1.0 |
| FWER p-Value | 0.795 |
| PROBE | DESCRIPTION (from dataset) | GENE SYMBOL | GENE_TITLE | RANK IN GENE LIST | RANK METRIC SCORE | RUNNING ES | CORE ENRICHMENT | |
|---|---|---|---|---|---|---|---|---|
| 1 | C8B | 6770687 | 6350 | 0.029 | -0.3384 | No | ||
| 2 | MBL2 | 6370446 | 6907 | 0.017 | -0.3666 | No | ||
| 3 | C1S | 840184 6840114 | 7990 | -0.002 | -0.4246 | No | ||
| 4 | C9 | 5550452 5690253 | 9944 | -0.035 | -0.5260 | No | ||
| 5 | C8A | 2190601 | 12743 | -0.126 | -0.6635 | No | ||
| 6 | CFD | 2320736 | 12965 | -0.140 | -0.6610 | No | ||
| 7 | C6 | 1770154 2900129 | 12992 | -0.141 | -0.6480 | No | ||
| 8 | C1R | 2340025 3290152 4850452 | 13336 | -0.167 | -0.6493 | No | ||
| 9 | MASP1 | 1780619 2900066 | 13761 | -0.206 | -0.6510 | No | ||
| 10 | C1QB | 5910292 | 17030 | -1.214 | -0.7023 | Yes | ||
| 11 | C3 | 1740372 | 17116 | -1.267 | -0.5772 | Yes | ||
| 12 | C1QA | 5390687 | 17695 | -1.694 | -0.4347 | Yes | ||
| 13 | C1QC | 5700131 | 17801 | -1.798 | -0.2563 | Yes | ||
| 14 | C2 | 5390465 | 18490 | -2.930 | 0.0068 | Yes |

