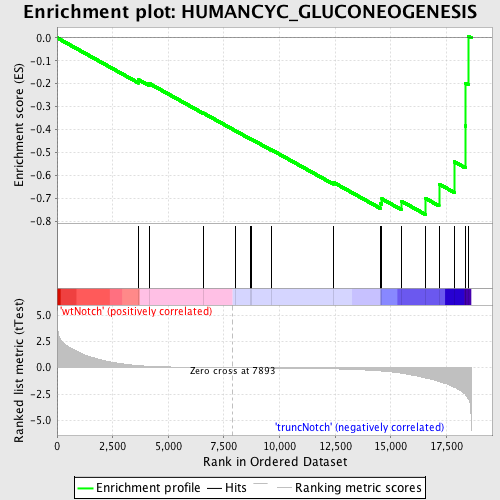
Profile of the Running ES Score & Positions of GeneSet Members on the Rank Ordered List
| Dataset | Set_03_truncNotch_versus_wtNotch.phenotype_truncNotch_versus_wtNotch.cls #wtNotch_versus_truncNotch.phenotype_truncNotch_versus_wtNotch.cls #wtNotch_versus_truncNotch_repos |
| Phenotype | phenotype_truncNotch_versus_wtNotch.cls#wtNotch_versus_truncNotch_repos |
| Upregulated in class | truncNotch |
| GeneSet | HUMANCYC_GLUCONEOGENESIS |
| Enrichment Score (ES) | -0.7698259 |
| Normalized Enrichment Score (NES) | -1.5836943 |
| Nominal p-value | 0.0067453627 |
| FDR q-value | 0.3730799 |
| FWER p-Value | 0.918 |
| PROBE | DESCRIPTION (from dataset) | GENE SYMBOL | GENE_TITLE | RANK IN GENE LIST | RANK METRIC SCORE | RUNNING ES | CORE ENRICHMENT | |
|---|---|---|---|---|---|---|---|---|
| 1 | MDH1 | 6660358 6760731 | 3666 | 0.194 | -0.1830 | No | ||
| 2 | ENO2 | 2320068 | 4140 | 0.133 | -0.1988 | No | ||
| 3 | BPGM | 5080520 | 6567 | 0.024 | -0.3275 | No | ||
| 4 | ME2 | 5080121 | 8010 | -0.002 | -0.4049 | No | ||
| 5 | PGK1 | 1570494 630300 | 8688 | -0.013 | -0.4403 | No | ||
| 6 | PGK2 | 2650091 | 8725 | -0.014 | -0.4413 | No | ||
| 7 | ALDOB | 4730324 | 9623 | -0.029 | -0.4874 | No | ||
| 8 | FBP2 | 1580193 | 12411 | -0.109 | -0.6294 | No | ||
| 9 | ALDOC | 450121 610427 | 14524 | -0.304 | -0.7208 | Yes | ||
| 10 | GAPDHS | 2690463 | 14596 | -0.317 | -0.7017 | Yes | ||
| 11 | MDH2 | 1850601 | 15469 | -0.511 | -0.7114 | Yes | ||
| 12 | ENO3 | 5270136 | 16556 | -0.967 | -0.6996 | Yes | ||
| 13 | PGAM1 | 2570133 | 17167 | -1.311 | -0.6371 | Yes | ||
| 14 | FBP1 | 1470762 | 17854 | -1.846 | -0.5400 | Yes | ||
| 15 | ENO1 | 5340128 | 18350 | -2.516 | -0.3839 | Yes | ||
| 16 | PGAM2 | 3610605 | 18368 | -2.574 | -0.1978 | Yes | ||
| 17 | ALDOA | 6290672 | 18479 | -2.907 | 0.0074 | Yes |

