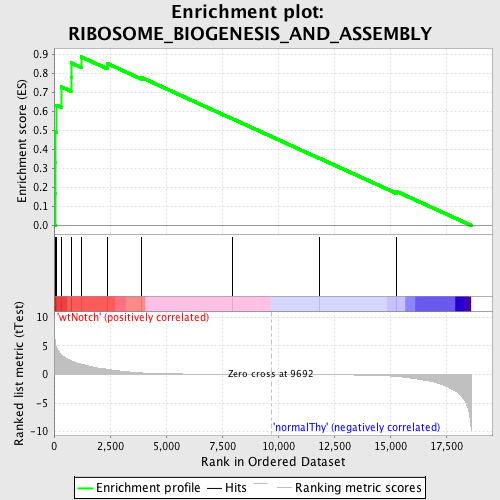
Profile of the Running ES Score & Positions of GeneSet Members on the Rank Ordered List
| Dataset | Set_03_wtNotch_versus_normalThy.phenotype_wtNotch_versus_normalThy.cls #wtNotch_versus_normalThy.phenotype_wtNotch_versus_normalThy.cls #wtNotch_versus_normalThy_repos |
| Phenotype | phenotype_wtNotch_versus_normalThy.cls#wtNotch_versus_normalThy_repos |
| Upregulated in class | wtNotch |
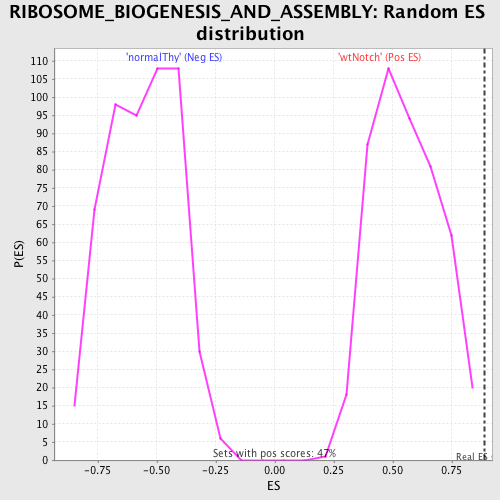
| GeneSet | RIBOSOME_BIOGENESIS_AND_ASSEMBLY |
| Enrichment Score (ES) | 0.8868893 |
| Normalized Enrichment Score (NES) | 1.595863 |
| Nominal p-value | 0.0 |
| FDR q-value | 0.14261897 |
| FWER p-Value | 0.866 |
| PROBE | DESCRIPTION (from dataset) | GENE SYMBOL | GENE_TITLE | RANK IN GENE LIST | RANK METRIC SCORE | RUNNING ES | CORE ENRICHMENT | |
|---|---|---|---|---|---|---|---|---|
| 1 | NOLA2 | 4060167 | 57 | 5.488 | 0.1666 | Yes | ||
| 2 | FBL | 5130020 | 61 | 5.340 | 0.3315 | Yes | ||
| 3 | RRP9 | 630451 | 70 | 5.197 | 0.4917 | Yes | ||
| 4 | NOLC1 | 2350195 | 110 | 4.643 | 0.6331 | Yes | ||
| 5 | EXOSC2 | 6900471 | 333 | 3.477 | 0.7287 | Yes | ||
| 6 | NOL5A | 5570139 | 757 | 2.422 | 0.7808 | Yes | ||
| 7 | EXOSC7 | 520538 | 763 | 2.411 | 0.8551 | Yes | ||
| 8 | POP4 | 4560600 | 1209 | 1.802 | 0.8869 | Yes | ||
| 9 | SDAD1 | 4230575 | 2383 | 0.892 | 0.8514 | No | ||
| 10 | EXOSC3 | 1740064 | 3908 | 0.274 | 0.7780 | No | ||
| 11 | GEMIN4 | 130278 2230075 | 7952 | 0.028 | 0.5615 | No | ||
| 12 | NPM1 | 4730427 | 11866 | -0.036 | 0.3523 | No | ||
| 13 | RPS14 | 430541 | 15300 | -0.339 | 0.1782 | No |