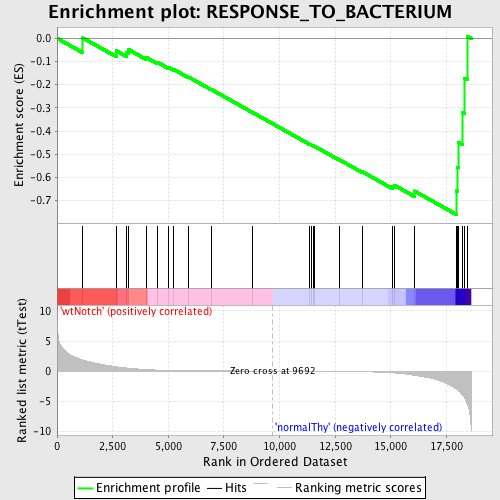
Profile of the Running ES Score & Positions of GeneSet Members on the Rank Ordered List
| Dataset | Set_03_wtNotch_versus_normalThy.phenotype_wtNotch_versus_normalThy.cls #wtNotch_versus_normalThy.phenotype_wtNotch_versus_normalThy.cls #wtNotch_versus_normalThy_repos |
| Phenotype | phenotype_wtNotch_versus_normalThy.cls#wtNotch_versus_normalThy_repos |
| Upregulated in class | normalThy |
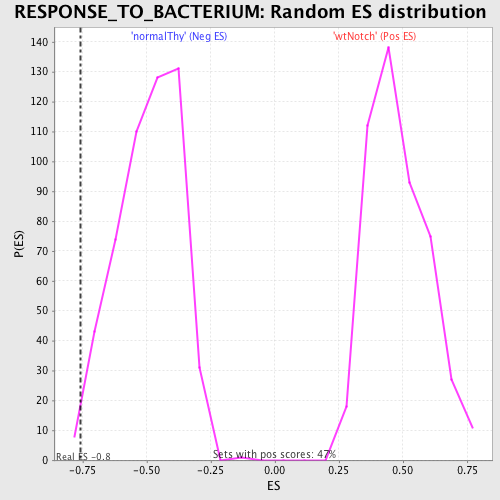
| GeneSet | RESPONSE_TO_BACTERIUM |
| Enrichment Score (ES) | -0.75996643 |
| Normalized Enrichment Score (NES) | -1.5454278 |
| Nominal p-value | 0.009505703 |
| FDR q-value | 0.2375143 |
| FWER p-Value | 0.992 |
| PROBE | DESCRIPTION (from dataset) | GENE SYMBOL | GENE_TITLE | RANK IN GENE LIST | RANK METRIC SCORE | RUNNING ES | CORE ENRICHMENT | |
|---|---|---|---|---|---|---|---|---|
| 1 | IL10 | 2340685 2640541 2850403 6590286 | 1156 | 1.855 | 0.0014 | No | ||
| 2 | SLC11A1 | 940286 2810435 6370647 | 2651 | 0.735 | -0.0538 | No | ||
| 3 | CFP | 2100619 | 3107 | 0.536 | -0.0599 | No | ||
| 4 | IL12A | 7100551 | 3220 | 0.492 | -0.0491 | No | ||
| 5 | PGLYRP4 | 3780411 | 3998 | 0.253 | -0.0823 | No | ||
| 6 | STAB1 | 5390707 | 4508 | 0.178 | -0.1035 | No | ||
| 7 | SPACA3 | 1850161 | 4986 | 0.132 | -0.1246 | No | ||
| 8 | DEFB103A | 50014 | 5243 | 0.116 | -0.1344 | No | ||
| 9 | NLRC4 | 5570332 | 5901 | 0.083 | -0.1670 | No | ||
| 10 | TLR3 | 6760451 | 6944 | 0.049 | -0.2213 | No | ||
| 11 | DMBT1 | 7050270 | 8768 | 0.014 | -0.3189 | No | ||
| 12 | PGLYRP3 | 6350403 | 11342 | -0.025 | -0.4564 | No | ||
| 13 | NOD2 | 2510050 | 11446 | -0.027 | -0.4610 | No | ||
| 14 | CHIT1 | 7050347 | 11544 | -0.029 | -0.4652 | No | ||
| 15 | WFDC12 | 6980647 | 11568 | -0.030 | -0.4655 | No | ||
| 16 | LALBA | 6940685 | 12699 | -0.056 | -0.5243 | No | ||
| 17 | CD24 | 1780091 | 13708 | -0.100 | -0.5751 | No | ||
| 18 | TLR6 | 510102 3390148 | 15077 | -0.275 | -0.6393 | No | ||
| 19 | DEFB127 | 520564 | 15145 | -0.288 | -0.6331 | No | ||
| 20 | STAB2 | 4810452 | 16058 | -0.685 | -0.6586 | Yes | ||
| 21 | PGLYRP2 | 2340086 | 17943 | -2.966 | -0.6584 | Yes | ||
| 22 | SPN | 3520338 3870671 | 17994 | -3.071 | -0.5559 | Yes | ||
| 23 | BCL10 | 2360397 | 18036 | -3.190 | -0.4488 | Yes | ||
| 24 | CAMP | 6290735 | 18234 | -4.034 | -0.3212 | Yes | ||
| 25 | NOD1 | 2360368 | 18318 | -4.467 | -0.1727 | Yes | ||
| 26 | PGLYRP1 | 6760242 | 18442 | -5.508 | 0.0094 | Yes |