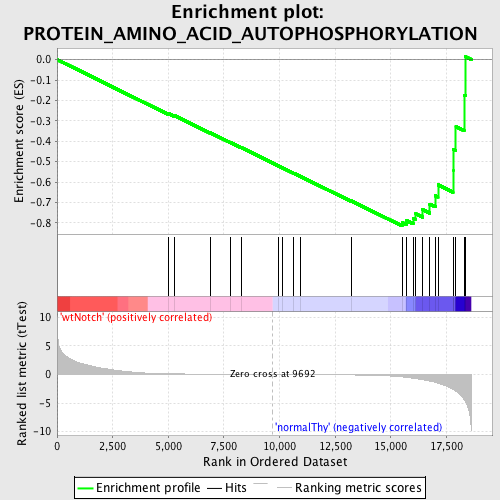
Profile of the Running ES Score & Positions of GeneSet Members on the Rank Ordered List
| Dataset | Set_03_wtNotch_versus_normalThy.phenotype_wtNotch_versus_normalThy.cls #wtNotch_versus_normalThy.phenotype_wtNotch_versus_normalThy.cls #wtNotch_versus_normalThy_repos |
| Phenotype | phenotype_wtNotch_versus_normalThy.cls#wtNotch_versus_normalThy_repos |
| Upregulated in class | normalThy |
| GeneSet | PROTEIN_AMINO_ACID_AUTOPHOSPHORYLATION |
| Enrichment Score (ES) | -0.814902 |
| Normalized Enrichment Score (NES) | -1.6428039 |
| Nominal p-value | 0.0 |
| FDR q-value | 0.3551212 |
| FWER p-Value | 0.514 |
| PROBE | DESCRIPTION (from dataset) | GENE SYMBOL | GENE_TITLE | RANK IN GENE LIST | RANK METRIC SCORE | RUNNING ES | CORE ENRICHMENT | |
|---|---|---|---|---|---|---|---|---|
| 1 | TNK1 | 4730279 | 5017 | 0.130 | -0.2646 | No | ||
| 2 | TTN | 2320161 4670056 6550026 | 5291 | 0.113 | -0.2747 | No | ||
| 3 | MAP3K9 | 3290707 | 6885 | 0.050 | -0.3584 | No | ||
| 4 | AKT1 | 5290746 | 7808 | 0.031 | -0.4067 | No | ||
| 5 | MAP3K10 | 3360168 4850180 | 8267 | 0.023 | -0.4304 | No | ||
| 6 | MAP3K13 | 3190017 | 9942 | -0.003 | -0.5203 | No | ||
| 7 | CDKL5 | 2450070 | 10141 | -0.006 | -0.5307 | No | ||
| 8 | MYO3A | 5290494 | 10627 | -0.014 | -0.5562 | No | ||
| 9 | MAP3K12 | 2470373 6420162 | 10936 | -0.019 | -0.5721 | No | ||
| 10 | PAK1 | 4540315 | 13219 | -0.075 | -0.6918 | No | ||
| 11 | INSR | 1190504 | 15509 | -0.415 | -0.7982 | Yes | ||
| 12 | LMTK2 | 6650692 | 15701 | -0.498 | -0.7885 | Yes | ||
| 13 | UHMK1 | 3850670 6450064 | 16003 | -0.654 | -0.7785 | Yes | ||
| 14 | PAK2 | 360438 7050068 | 16123 | -0.727 | -0.7557 | Yes | ||
| 15 | EIF2AK1 | 2470301 | 16431 | -0.915 | -0.7354 | Yes | ||
| 16 | CRKRS | 510537 2510551 | 16752 | -1.127 | -0.7074 | Yes | ||
| 17 | CAMKK2 | 5270047 | 16998 | -1.342 | -0.6666 | Yes | ||
| 18 | IGF1R | 3360494 | 17121 | -1.500 | -0.6130 | Yes | ||
| 19 | EIF2AK3 | 4280161 | 17796 | -2.616 | -0.5442 | Yes | ||
| 20 | STK4 | 2640152 | 17801 | -2.623 | -0.4391 | Yes | ||
| 21 | MAP3K11 | 7000039 | 17928 | -2.933 | -0.3281 | Yes | ||
| 22 | DYRK1A | 3190181 | 18295 | -4.333 | -0.1738 | Yes | ||
| 23 | MAP3K3 | 610685 | 18366 | -4.757 | 0.0134 | Yes |

