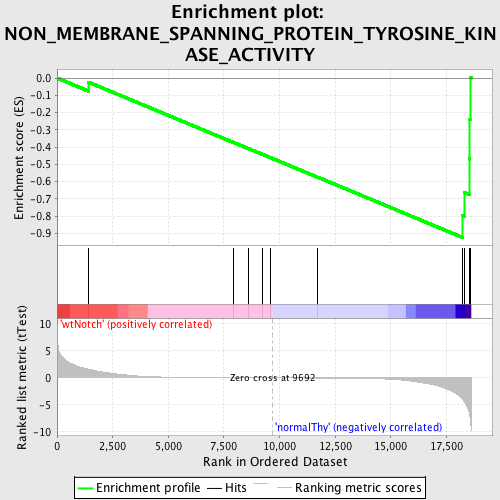
Profile of the Running ES Score & Positions of GeneSet Members on the Rank Ordered List
| Dataset | Set_03_wtNotch_versus_normalThy.phenotype_wtNotch_versus_normalThy.cls #wtNotch_versus_normalThy.phenotype_wtNotch_versus_normalThy.cls #wtNotch_versus_normalThy_repos |
| Phenotype | phenotype_wtNotch_versus_normalThy.cls#wtNotch_versus_normalThy_repos |
| Upregulated in class | normalThy |
| GeneSet | NON_MEMBRANE_SPANNING_PROTEIN_TYROSINE_KINASE_ACTIVITY |
| Enrichment Score (ES) | -0.9242695 |
| Normalized Enrichment Score (NES) | -1.6032404 |
| Nominal p-value | 0.0 |
| FDR q-value | 0.23832986 |
| FWER p-Value | 0.824 |
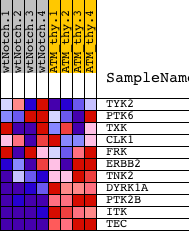
| PROBE | DESCRIPTION (from dataset) | GENE SYMBOL | GENE_TITLE | RANK IN GENE LIST | RANK METRIC SCORE | RUNNING ES | CORE ENRICHMENT | |
|---|---|---|---|---|---|---|---|---|
| 1 | TYK2 | 1660465 1740736 | 1410 | 1.615 | -0.0239 | No | ||
| 2 | PTK6 | 6860735 | 7945 | 0.029 | -0.3742 | No | ||
| 3 | TXK | 2320338 | 8603 | 0.017 | -0.4090 | No | ||
| 4 | CLK1 | 1780551 2100102 2340347 2480347 | 9241 | 0.007 | -0.4430 | No | ||
| 5 | FRK | 5130333 | 9575 | 0.002 | -0.4608 | No | ||
| 6 | ERBB2 | 3830673 | 11708 | -0.032 | -0.5744 | No | ||
| 7 | TNK2 | 1570390 | 18219 | -3.929 | -0.7982 | Yes | ||
| 8 | DYRK1A | 3190181 | 18295 | -4.333 | -0.6632 | Yes | ||
| 9 | PTK2B | 4730411 | 18521 | -6.456 | -0.4681 | Yes | ||
| 10 | ITK | 2230592 | 18551 | -7.151 | -0.2401 | Yes | ||
| 11 | TEC | 1400576 | 18571 | -7.590 | 0.0024 | Yes |