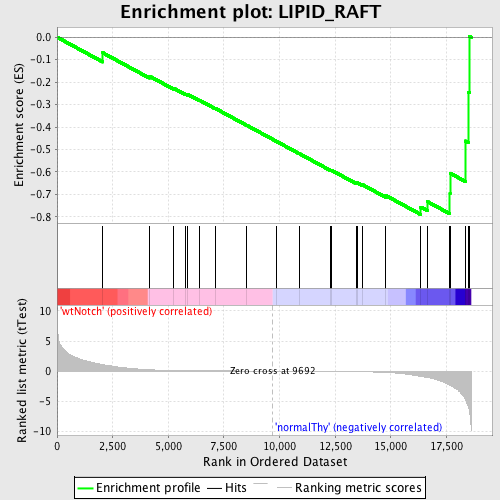
Profile of the Running ES Score & Positions of GeneSet Members on the Rank Ordered List
| Dataset | Set_03_wtNotch_versus_normalThy.phenotype_wtNotch_versus_normalThy.cls #wtNotch_versus_normalThy.phenotype_wtNotch_versus_normalThy.cls #wtNotch_versus_normalThy_repos |
| Phenotype | phenotype_wtNotch_versus_normalThy.cls#wtNotch_versus_normalThy_repos |
| Upregulated in class | normalThy |
| GeneSet | LIPID_RAFT |
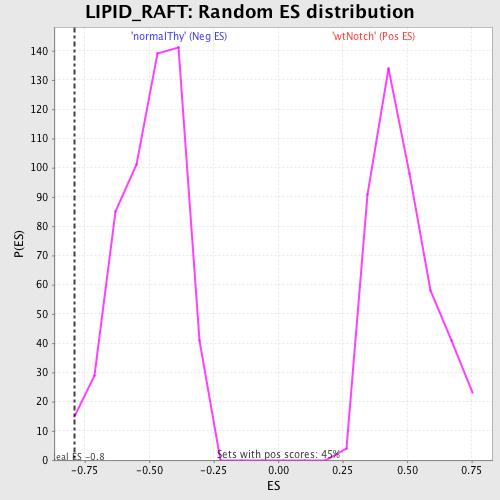
| Enrichment Score (ES) | -0.7896205 |
| Normalized Enrichment Score (NES) | -1.590067 |
| Nominal p-value | 0.00907441 |
| FDR q-value | 0.21608186 |
| FWER p-Value | 0.894 |
| PROBE | DESCRIPTION (from dataset) | GENE SYMBOL | GENE_TITLE | RANK IN GENE LIST | RANK METRIC SCORE | RUNNING ES | CORE ENRICHMENT | |
|---|---|---|---|---|---|---|---|---|
| 1 | CLN3 | 780368 | 2053 | 1.063 | -0.0694 | No | ||
| 2 | CAV1 | 870025 | 4143 | 0.228 | -0.1730 | No | ||
| 3 | CD48 | 1570647 | 5228 | 0.117 | -0.2268 | No | ||
| 4 | LYN | 6040600 | 5783 | 0.087 | -0.2532 | No | ||
| 5 | STX12 | 610451 | 5878 | 0.084 | -0.2550 | No | ||
| 6 | LAT2 | 5340440 | 6402 | 0.064 | -0.2807 | No | ||
| 7 | MAL | 4280487 4590239 | 7104 | 0.045 | -0.3167 | No | ||
| 8 | CAV2 | 5130286 5130563 | 8519 | 0.018 | -0.3920 | No | ||
| 9 | BTK | 3130044 | 9841 | -0.002 | -0.4630 | No | ||
| 10 | ABCA1 | 6290156 | 10877 | -0.018 | -0.5180 | No | ||
| 11 | GHSR | 1980465 7050521 | 12284 | -0.045 | -0.5918 | No | ||
| 12 | PIP5K3 | 5360112 | 12331 | -0.046 | -0.5925 | No | ||
| 13 | SHH | 5570400 | 13460 | -0.086 | -0.6499 | No | ||
| 14 | CD79A | 3450563 | 13486 | -0.087 | -0.6479 | No | ||
| 15 | CD24 | 1780091 | 13708 | -0.100 | -0.6559 | No | ||
| 16 | PAG1 | 5910397 | 14768 | -0.208 | -0.7049 | No | ||
| 17 | PRNP | 3140687 | 16345 | -0.863 | -0.7563 | Yes | ||
| 18 | LAT | 3170025 | 16642 | -1.039 | -0.7322 | Yes | ||
| 19 | PI4K2A | 6860458 | 17658 | -2.346 | -0.6964 | Yes | ||
| 20 | LCK | 3360142 | 17665 | -2.357 | -0.6058 | Yes | ||
| 21 | CARD11 | 70338 | 18353 | -4.684 | -0.4622 | Yes | ||
| 22 | PPT1 | 6450440 | 18478 | -5.815 | -0.2448 | Yes | ||
| 23 | FLOT1 | 1660575 1690040 | 18525 | -6.541 | 0.0049 | Yes |