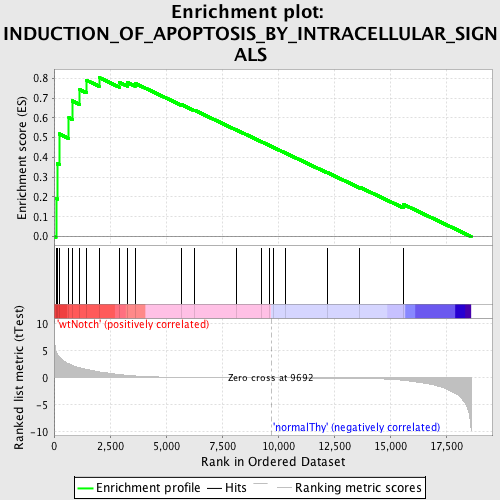
Profile of the Running ES Score & Positions of GeneSet Members on the Rank Ordered List
| Dataset | Set_03_wtNotch_versus_normalThy.phenotype_wtNotch_versus_normalThy.cls #wtNotch_versus_normalThy.phenotype_wtNotch_versus_normalThy.cls #wtNotch_versus_normalThy_repos |
| Phenotype | phenotype_wtNotch_versus_normalThy.cls#wtNotch_versus_normalThy_repos |
| Upregulated in class | wtNotch |
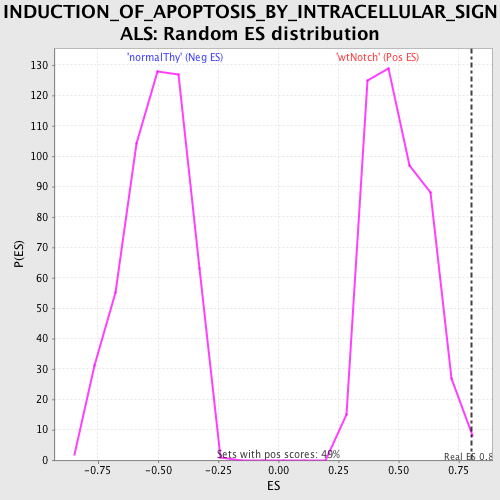
| GeneSet | INDUCTION_OF_APOPTOSIS_BY_INTRACELLULAR_SIGNALS |
| Enrichment Score (ES) | 0.803403 |
| Normalized Enrichment Score (NES) | 1.6142595 |
| Nominal p-value | 0.008179959 |
| FDR q-value | 0.14054734 |
| FWER p-Value | 0.774 |
| PROBE | DESCRIPTION (from dataset) | GENE SYMBOL | GENE_TITLE | RANK IN GENE LIST | RANK METRIC SCORE | RUNNING ES | CORE ENRICHMENT | |
|---|---|---|---|---|---|---|---|---|
| 1 | BAX | 3830008 | 85 | 4.907 | 0.1923 | Yes | ||
| 2 | PCBP4 | 6350722 | 140 | 4.445 | 0.3678 | Yes | ||
| 3 | TP53 | 6130707 | 229 | 3.880 | 0.5187 | Yes | ||
| 4 | CUL1 | 1990632 | 659 | 2.601 | 0.6000 | Yes | ||
| 5 | CDKN1A | 4050088 6400706 | 809 | 2.336 | 0.6858 | Yes | ||
| 6 | CUL3 | 1850520 | 1147 | 1.860 | 0.7423 | Yes | ||
| 7 | BCL3 | 3990440 | 1455 | 1.580 | 0.7892 | Yes | ||
| 8 | ABL1 | 1050593 2030050 4010114 | 2011 | 1.099 | 0.8034 | Yes | ||
| 9 | RNF7 | 2030242 | 2925 | 0.605 | 0.7786 | No | ||
| 10 | PML | 50093 2190435 2450402 3840082 | 3269 | 0.472 | 0.7791 | No | ||
| 11 | CUL4A | 1170088 2320008 2470278 | 3616 | 0.349 | 0.7744 | No | ||
| 12 | CIDEB | 3360274 | 5687 | 0.092 | 0.6668 | No | ||
| 13 | CUL2 | 4200278 | 6288 | 0.068 | 0.6373 | No | ||
| 14 | AIFM1 | 2060070 5890086 | 8141 | 0.025 | 0.5387 | No | ||
| 15 | LGALS12 | 3940242 | 9268 | 0.006 | 0.4784 | No | ||
| 16 | BRCA1 | 4780669 | 9605 | 0.001 | 0.4604 | No | ||
| 17 | IFI16 | 6520601 | 9778 | -0.001 | 0.4512 | No | ||
| 18 | CIDEA | 4560020 | 10343 | -0.009 | 0.4212 | No | ||
| 19 | CHEK2 | 610139 1050022 | 12183 | -0.043 | 0.3240 | No | ||
| 20 | CUL5 | 450142 | 13653 | -0.096 | 0.2489 | No | ||
| 21 | SFN | 6290301 7510608 | 15592 | -0.446 | 0.1626 | No |