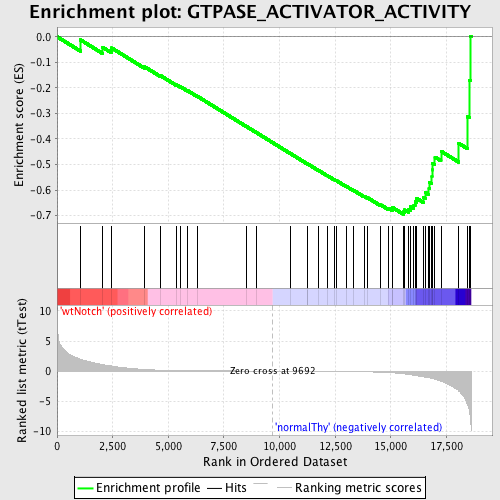
Profile of the Running ES Score & Positions of GeneSet Members on the Rank Ordered List
| Dataset | Set_03_wtNotch_versus_normalThy.phenotype_wtNotch_versus_normalThy.cls #wtNotch_versus_normalThy.phenotype_wtNotch_versus_normalThy.cls #wtNotch_versus_normalThy_repos |
| Phenotype | phenotype_wtNotch_versus_normalThy.cls#wtNotch_versus_normalThy_repos |
| Upregulated in class | normalThy |
| GeneSet | GTPASE_ACTIVATOR_ACTIVITY |
| Enrichment Score (ES) | -0.6958395 |
| Normalized Enrichment Score (NES) | -1.5751007 |
| Nominal p-value | 0.0036231885 |
| FDR q-value | 0.2585839 |
| FWER p-Value | 0.95 |
| PROBE | DESCRIPTION (from dataset) | GENE SYMBOL | GENE_TITLE | RANK IN GENE LIST | RANK METRIC SCORE | RUNNING ES | CORE ENRICHMENT | |
|---|---|---|---|---|---|---|---|---|
| 1 | RASAL1 | 3710112 | 1052 | 1.966 | -0.0123 | No | ||
| 2 | CENTA1 | 2360128 5220037 | 2034 | 1.074 | -0.0408 | No | ||
| 3 | ARFGEF1 | 6760494 | 2449 | 0.850 | -0.0439 | No | ||
| 4 | ABR | 610079 1170609 3610195 5670050 | 3918 | 0.272 | -0.1168 | No | ||
| 5 | SOS1 | 7050338 | 4633 | 0.165 | -0.1515 | No | ||
| 6 | RGS6 | 6040601 | 5364 | 0.109 | -0.1884 | No | ||
| 7 | RABGAP1 | 5050397 | 5542 | 0.100 | -0.1956 | No | ||
| 8 | RASA1 | 1240315 | 5862 | 0.084 | -0.2109 | No | ||
| 9 | DOCK4 | 5910102 | 6305 | 0.067 | -0.2332 | No | ||
| 10 | RGS20 | 4540541 4730086 | 8495 | 0.019 | -0.3506 | No | ||
| 11 | ALDH1A1 | 6520706 | 8977 | 0.011 | -0.3763 | No | ||
| 12 | RGS2 | 1090736 | 10477 | -0.011 | -0.4568 | No | ||
| 13 | RASGRP3 | 6020504 | 11261 | -0.024 | -0.4984 | No | ||
| 14 | DEPDC2 | 5220102 | 11272 | -0.024 | -0.4984 | No | ||
| 15 | RGS11 | 2360041 | 11734 | -0.033 | -0.5225 | No | ||
| 16 | ARHGAP5 | 2510619 3360035 | 12137 | -0.042 | -0.5432 | No | ||
| 17 | ARHGAP10 | 510086 780324 | 12465 | -0.049 | -0.5597 | No | ||
| 18 | NF1 | 6980433 | 12559 | -0.052 | -0.5635 | No | ||
| 19 | RGS4 | 2970711 | 13010 | -0.067 | -0.5862 | No | ||
| 20 | OPHN1 | 2360100 | 13306 | -0.079 | -0.6003 | No | ||
| 21 | RGS9 | 1050273 | 13796 | -0.106 | -0.6243 | No | ||
| 22 | DLC1 | 1090632 6450594 | 13941 | -0.116 | -0.6294 | No | ||
| 23 | RGS3 | 60670 540736 1340180 1500369 3390735 4010131 4610402 6380114 | 14553 | -0.173 | -0.6584 | No | ||
| 24 | RGS1 | 4060347 4540181 | 14916 | -0.238 | -0.6725 | No | ||
| 25 | BCR | 2260020 4230180 6040195 | 15064 | -0.272 | -0.6743 | No | ||
| 26 | CHN2 | 870528 | 15086 | -0.277 | -0.6692 | No | ||
| 27 | CENTD2 | 60408 2510156 6100494 | 15582 | -0.444 | -0.6858 | Yes | ||
| 28 | RACGAP1 | 3990162 6620736 | 15631 | -0.462 | -0.6780 | Yes | ||
| 29 | CDC42EP2 | 540079 2970138 | 15808 | -0.545 | -0.6751 | Yes | ||
| 30 | TSC2 | 1450494 | 15889 | -0.594 | -0.6660 | Yes | ||
| 31 | VAV3 | 1050731 2450242 2680653 | 16036 | -0.671 | -0.6587 | Yes | ||
| 32 | RGS12 | 1190082 5390369 | 16091 | -0.707 | -0.6457 | Yes | ||
| 33 | RASA2 | 7100706 | 16161 | -0.743 | -0.6326 | Yes | ||
| 34 | RASA4 | 110296 4200114 | 16459 | -0.937 | -0.6274 | Yes | ||
| 35 | BNIP2 | 1410475 6770088 | 16563 | -0.999 | -0.6104 | Yes | ||
| 36 | SIPA1 | 5220687 | 16714 | -1.098 | -0.5937 | Yes | ||
| 37 | THY1 | 5910162 | 16728 | -1.110 | -0.5693 | Yes | ||
| 38 | GMIP | 6980193 | 16848 | -1.203 | -0.5486 | Yes | ||
| 39 | RALBP1 | 4780632 | 16852 | -1.205 | -0.5215 | Yes | ||
| 40 | ARFGAP3 | 3390717 | 16857 | -1.209 | -0.4944 | Yes | ||
| 41 | RGS16 | 780091 | 16984 | -1.327 | -0.4712 | Yes | ||
| 42 | RANGAP1 | 2320593 6650601 | 17256 | -1.669 | -0.4481 | Yes | ||
| 43 | RASA3 | 2060465 | 18053 | -3.265 | -0.4172 | Yes | ||
| 44 | RGS14 | 380086 | 18446 | -5.536 | -0.3133 | Yes | ||
| 45 | ARHGAP4 | 1940022 | 18526 | -6.555 | -0.1695 | Yes | ||
| 46 | MYO9B | 1230435 3060358 | 18572 | -7.717 | 0.0024 | Yes |

