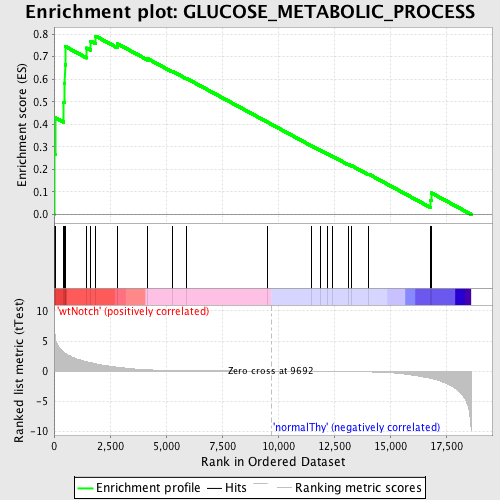
Profile of the Running ES Score & Positions of GeneSet Members on the Rank Ordered List
| Dataset | Set_03_wtNotch_versus_normalThy.phenotype_wtNotch_versus_normalThy.cls #wtNotch_versus_normalThy.phenotype_wtNotch_versus_normalThy.cls #wtNotch_versus_normalThy_repos |
| Phenotype | phenotype_wtNotch_versus_normalThy.cls#wtNotch_versus_normalThy_repos |
| Upregulated in class | wtNotch |
| GeneSet | GLUCOSE_METABOLIC_PROCESS |
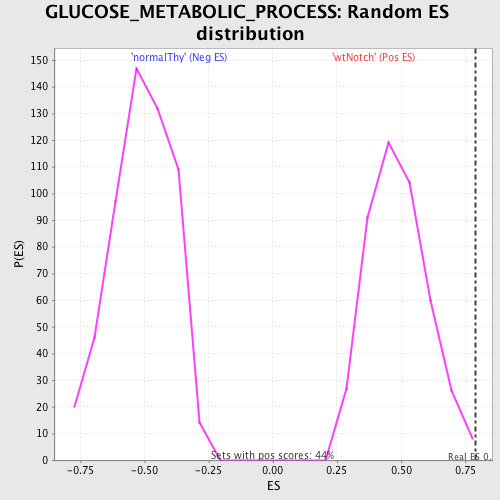
| Enrichment Score (ES) | 0.7913464 |
| Normalized Enrichment Score (NES) | 1.6299826 |
| Nominal p-value | 0.0068965517 |
| FDR q-value | 0.19259146 |
| FWER p-Value | 0.673 |
| PROBE | DESCRIPTION (from dataset) | GENE SYMBOL | GENE_TITLE | RANK IN GENE LIST | RANK METRIC SCORE | RUNNING ES | CORE ENRICHMENT | |
|---|---|---|---|---|---|---|---|---|
| 1 | PFKM | 1990156 5720168 | 4 | 9.552 | 0.2687 | Yes | ||
| 2 | ALDOA | 6290672 | 47 | 5.798 | 0.4297 | Yes | ||
| 3 | PFKL | 6200167 | 428 | 3.124 | 0.4972 | Yes | ||
| 4 | PGD | 6840048 | 452 | 3.055 | 0.5820 | Yes | ||
| 5 | PGLS | 2120324 | 486 | 2.975 | 0.6640 | Yes | ||
| 6 | SLC25A10 | 1400609 | 508 | 2.918 | 0.7450 | Yes | ||
| 7 | ARPP-19 | 5700025 | 1454 | 1.581 | 0.7387 | Yes | ||
| 8 | ATF4 | 730441 1740195 | 1631 | 1.410 | 0.7689 | Yes | ||
| 9 | ACN9 | 6660180 | 1857 | 1.226 | 0.7913 | Yes | ||
| 10 | PDK3 | 510484 | 2815 | 0.652 | 0.7582 | No | ||
| 11 | UGP2 | 7000647 | 4186 | 0.221 | 0.6908 | No | ||
| 12 | PDK4 | 6400300 | 5275 | 0.114 | 0.6355 | No | ||
| 13 | PPARGC1A | 4670040 | 5917 | 0.082 | 0.6033 | No | ||
| 14 | GAPDHS | 2690463 | 9513 | 0.003 | 0.4101 | No | ||
| 15 | GCK | 2370273 | 11481 | -0.028 | 0.3051 | No | ||
| 16 | ALDOB | 4730324 | 11889 | -0.036 | 0.2842 | No | ||
| 17 | PFKFB1 | 2370128 | 12188 | -0.043 | 0.2694 | No | ||
| 18 | TKTL1 | 2810672 6760102 | 12436 | -0.048 | 0.2574 | No | ||
| 19 | HK1 | 4280402 | 13130 | -0.071 | 0.2222 | No | ||
| 20 | UGDH | 4730400 | 13278 | -0.077 | 0.2164 | No | ||
| 21 | BRS3 | 1740403 | 14049 | -0.125 | 0.1785 | No | ||
| 22 | PDK2 | 2690017 | 16814 | -1.184 | 0.0632 | No | ||
| 23 | PDK1 | 5290427 | 16837 | -1.195 | 0.0957 | No |