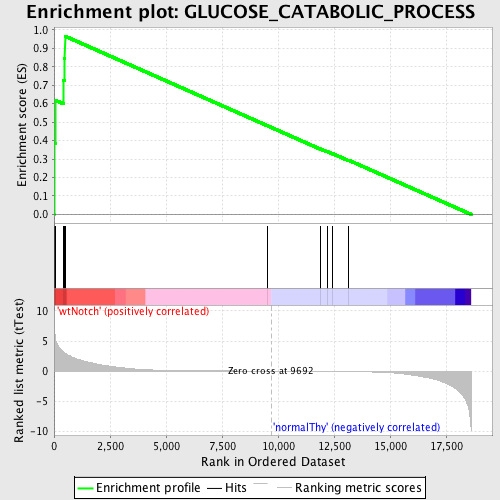
Profile of the Running ES Score & Positions of GeneSet Members on the Rank Ordered List
| Dataset | Set_03_wtNotch_versus_normalThy.phenotype_wtNotch_versus_normalThy.cls #wtNotch_versus_normalThy.phenotype_wtNotch_versus_normalThy.cls #wtNotch_versus_normalThy_repos |
| Phenotype | phenotype_wtNotch_versus_normalThy.cls#wtNotch_versus_normalThy_repos |
| Upregulated in class | wtNotch |
| GeneSet | GLUCOSE_CATABOLIC_PROCESS |
| Enrichment Score (ES) | 0.9659598 |
| Normalized Enrichment Score (NES) | 1.6531131 |
| Nominal p-value | 0.0 |
| FDR q-value | 0.24695197 |
| FWER p-Value | 0.521 |
| PROBE | DESCRIPTION (from dataset) | GENE SYMBOL | GENE_TITLE | RANK IN GENE LIST | RANK METRIC SCORE | RUNNING ES | CORE ENRICHMENT | |
|---|---|---|---|---|---|---|---|---|
| 1 | PFKM | 1990156 5720168 | 4 | 9.552 | 0.3864 | Yes | ||
| 2 | ALDOA | 6290672 | 47 | 5.798 | 0.6189 | Yes | ||
| 3 | PFKL | 6200167 | 428 | 3.124 | 0.7249 | Yes | ||
| 4 | PGD | 6840048 | 452 | 3.055 | 0.8473 | Yes | ||
| 5 | PGLS | 2120324 | 486 | 2.975 | 0.9660 | Yes | ||
| 6 | GAPDHS | 2690463 | 9513 | 0.003 | 0.4810 | No | ||
| 7 | ALDOB | 4730324 | 11889 | -0.036 | 0.3548 | No | ||
| 8 | PFKFB1 | 2370128 | 12188 | -0.043 | 0.3405 | No | ||
| 9 | TKTL1 | 2810672 6760102 | 12436 | -0.048 | 0.3292 | No | ||
| 10 | HK1 | 4280402 | 13130 | -0.071 | 0.2948 | No |

