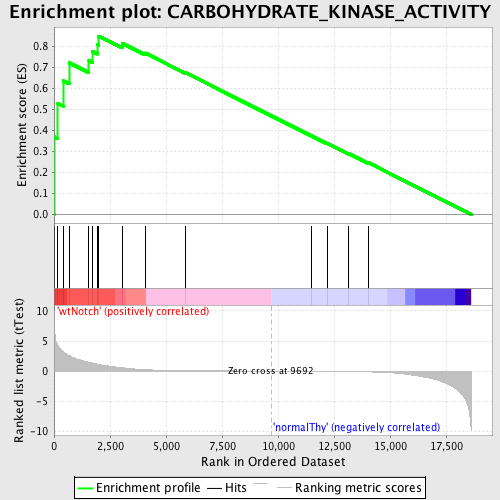
Profile of the Running ES Score & Positions of GeneSet Members on the Rank Ordered List
| Dataset | Set_03_wtNotch_versus_normalThy.phenotype_wtNotch_versus_normalThy.cls #wtNotch_versus_normalThy.phenotype_wtNotch_versus_normalThy.cls #wtNotch_versus_normalThy_repos |
| Phenotype | phenotype_wtNotch_versus_normalThy.cls#wtNotch_versus_normalThy_repos |
| Upregulated in class | wtNotch |
| GeneSet | CARBOHYDRATE_KINASE_ACTIVITY |
| Enrichment Score (ES) | 0.84889704 |
| Normalized Enrichment Score (NES) | 1.593548 |
| Nominal p-value | 0.0063965884 |
| FDR q-value | 0.13149919 |
| FWER p-Value | 0.881 |
| PROBE | DESCRIPTION (from dataset) | GENE SYMBOL | GENE_TITLE | RANK IN GENE LIST | RANK METRIC SCORE | RUNNING ES | CORE ENRICHMENT | |
|---|---|---|---|---|---|---|---|---|
| 1 | PFKM | 1990156 5720168 | 4 | 9.552 | 0.3703 | Yes | ||
| 2 | GALK1 | 840162 | 155 | 4.303 | 0.5291 | Yes | ||
| 3 | PFKL | 6200167 | 428 | 3.124 | 0.6357 | Yes | ||
| 4 | HK2 | 2640722 | 673 | 2.572 | 0.7223 | Yes | ||
| 5 | KHK | 1090204 3870204 | 1553 | 1.483 | 0.7326 | Yes | ||
| 6 | PRPS1 | 6350129 | 1706 | 1.347 | 0.7766 | Yes | ||
| 7 | PFKFB2 | 3940538 7100059 | 1949 | 1.145 | 0.8080 | Yes | ||
| 8 | GNE | 6100465 | 1991 | 1.110 | 0.8489 | Yes | ||
| 9 | PRPS2 | 3140707 | 3042 | 0.556 | 0.8140 | No | ||
| 10 | XYLB | 2640619 | 4063 | 0.241 | 0.7685 | No | ||
| 11 | PFKP | 70138 6760040 1170278 | 5877 | 0.084 | 0.6743 | No | ||
| 12 | GCK | 2370273 | 11481 | -0.028 | 0.3742 | No | ||
| 13 | PFKFB1 | 2370128 | 12188 | -0.043 | 0.3379 | No | ||
| 14 | HK1 | 4280402 | 13130 | -0.071 | 0.2901 | No | ||
| 15 | GALK2 | 2360632 | 14033 | -0.123 | 0.2464 | No |

