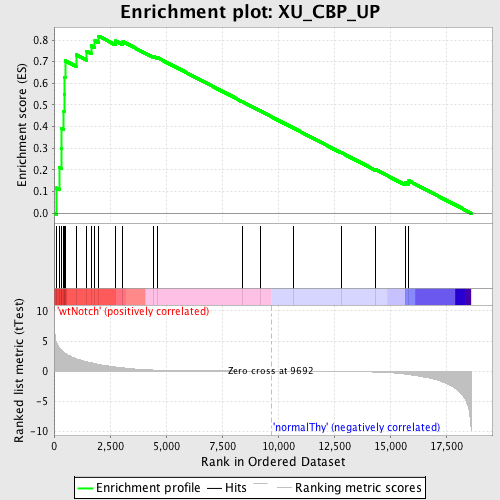
Profile of the Running ES Score & Positions of GeneSet Members on the Rank Ordered List
| Dataset | Set_03_wtNotch_versus_normalThy.phenotype_wtNotch_versus_normalThy.cls #wtNotch_versus_normalThy.phenotype_wtNotch_versus_normalThy.cls #wtNotch_versus_normalThy_repos |
| Phenotype | phenotype_wtNotch_versus_normalThy.cls#wtNotch_versus_normalThy_repos |
| Upregulated in class | wtNotch |
| GeneSet | XU_CBP_UP |
| Enrichment Score (ES) | 0.81794095 |
| Normalized Enrichment Score (NES) | 1.6580348 |
| Nominal p-value | 0.0 |
| FDR q-value | 0.05772832 |
| FWER p-Value | 0.651 |
| PROBE | DESCRIPTION (from dataset) | GENE SYMBOL | GENE_TITLE | RANK IN GENE LIST | RANK METRIC SCORE | RUNNING ES | CORE ENRICHMENT | |
|---|---|---|---|---|---|---|---|---|
| 1 | PRMT1 | 2850050 | 108 | 4.668 | 0.1166 | Yes | ||
| 2 | PPAN | 540398 | 242 | 3.832 | 0.2100 | Yes | ||
| 3 | LGMN | 3610301 | 314 | 3.557 | 0.2995 | Yes | ||
| 4 | TSTA3 | 1230100 | 326 | 3.504 | 0.3908 | Yes | ||
| 5 | HMOX1 | 1740687 | 407 | 3.190 | 0.4702 | Yes | ||
| 6 | ALG3 | 2650647 7100131 | 449 | 3.062 | 0.5483 | Yes | ||
| 7 | ADSL | 5570484 | 457 | 3.043 | 0.6278 | Yes | ||
| 8 | GNL3 | 4050338 4810500 | 491 | 2.967 | 0.7038 | Yes | ||
| 9 | XPOT | 7050184 | 985 | 2.059 | 0.7313 | Yes | ||
| 10 | NME4 | 3140736 5900446 | 1443 | 1.590 | 0.7485 | Yes | ||
| 11 | LRG1 | 5690605 | 1657 | 1.387 | 0.7734 | Yes | ||
| 12 | 2600005C20RIK | 1090746 5220242 | 1823 | 1.251 | 0.7973 | Yes | ||
| 13 | S100A6 | 1690204 | 1985 | 1.116 | 0.8179 | Yes | ||
| 14 | RAD1 | 4200551 | 2737 | 0.689 | 0.7956 | No | ||
| 15 | MCM2 | 5050139 | 3072 | 0.548 | 0.7921 | No | ||
| 16 | NVL | 2690687 6900735 | 4447 | 0.185 | 0.7230 | No | ||
| 17 | 9830147J24RIK | 2690451 | 4610 | 0.167 | 0.7187 | No | ||
| 18 | RCN1 | 2480041 | 8399 | 0.020 | 0.5155 | No | ||
| 19 | LRRN1 | 3290154 | 9225 | 0.007 | 0.4713 | No | ||
| 20 | MELA | 2340438 3450717 | 10679 | -0.015 | 0.3935 | No | ||
| 21 | PROM1 | 3170537 | 12823 | -0.060 | 0.2798 | No | ||
| 22 | CTLA2B | 4210168 | 14357 | -0.155 | 0.2015 | No | ||
| 23 | 8430420C20RIK | 6110465 | 15678 | -0.488 | 0.1433 | No | ||
| 24 | KTN1 | 70446 3450609 4560048 | 15838 | -0.560 | 0.1494 | No |

