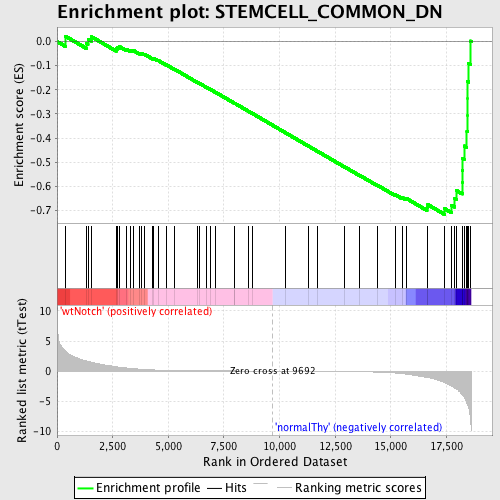
Profile of the Running ES Score & Positions of GeneSet Members on the Rank Ordered List
| Dataset | Set_03_wtNotch_versus_normalThy.phenotype_wtNotch_versus_normalThy.cls #wtNotch_versus_normalThy.phenotype_wtNotch_versus_normalThy.cls #wtNotch_versus_normalThy_repos |
| Phenotype | phenotype_wtNotch_versus_normalThy.cls#wtNotch_versus_normalThy_repos |
| Upregulated in class | normalThy |
| GeneSet | STEMCELL_COMMON_DN |
| Enrichment Score (ES) | -0.7169511 |
| Normalized Enrichment Score (NES) | -1.655513 |
| Nominal p-value | 0.0 |
| FDR q-value | 0.21775597 |
| FWER p-Value | 0.582 |
| PROBE | DESCRIPTION (from dataset) | GENE SYMBOL | GENE_TITLE | RANK IN GENE LIST | RANK METRIC SCORE | RUNNING ES | CORE ENRICHMENT | |
|---|---|---|---|---|---|---|---|---|
| 1 | D15WSU75E | 6900451 | 366 | 3.357 | 0.0225 | No | ||
| 2 | PTPRC | 130402 5290148 | 1316 | 1.706 | -0.0072 | No | ||
| 3 | CD68 | 6350450 | 1389 | 1.636 | 0.0095 | No | ||
| 4 | GRINA | 4570519 | 1532 | 1.503 | 0.0207 | No | ||
| 5 | SLC11A1 | 940286 2810435 6370647 | 2651 | 0.735 | -0.0303 | No | ||
| 6 | STMN1 | 1990717 | 2698 | 0.711 | -0.0238 | No | ||
| 7 | CSF1R | 2340110 6420408 | 2808 | 0.656 | -0.0215 | No | ||
| 8 | SIRPA | 130465 5700332 | 3137 | 0.521 | -0.0326 | No | ||
| 9 | BMP1 | 380594 2940576 3710593 | 3320 | 0.452 | -0.0367 | No | ||
| 10 | ZAP70 | 1410494 2260504 | 3430 | 0.417 | -0.0373 | No | ||
| 11 | PPP3CA | 4760332 6760092 | 3702 | 0.323 | -0.0479 | No | ||
| 12 | EFHD1 | 4070358 | 3814 | 0.296 | -0.0501 | No | ||
| 13 | ABR | 610079 1170609 3610195 5670050 | 3918 | 0.272 | -0.0523 | No | ||
| 14 | LY86 | 2230093 | 4300 | 0.204 | -0.0702 | No | ||
| 15 | GSN | 3830168 | 4342 | 0.200 | -0.0699 | No | ||
| 16 | SEPT5 | 460725 | 4538 | 0.175 | -0.0782 | No | ||
| 17 | RELN | 6510037 | 4897 | 0.140 | -0.0957 | No | ||
| 18 | KCNAB2 | 4850315 | 5283 | 0.114 | -0.1151 | No | ||
| 19 | EMR1 | 70136 1500592 | 6300 | 0.068 | -0.1689 | No | ||
| 20 | LAT2 | 5340440 | 6402 | 0.064 | -0.1736 | No | ||
| 21 | ABLIM1 | 580170 3710338 6520504 | 6721 | 0.054 | -0.1900 | No | ||
| 22 | CTSS | 1740056 | 6877 | 0.050 | -0.1977 | No | ||
| 23 | MAL | 4280487 4590239 | 7104 | 0.045 | -0.2093 | No | ||
| 24 | NIN | 3450576 5080048 | 7957 | 0.028 | -0.2549 | No | ||
| 25 | CBX4 | 70332 | 7990 | 0.028 | -0.2563 | No | ||
| 26 | CLEC4A | 2470292 | 8615 | 0.017 | -0.2897 | No | ||
| 27 | HDC | 4150463 | 8785 | 0.014 | -0.2986 | No | ||
| 28 | ACVRL1 | 3290600 | 10276 | -0.008 | -0.3787 | No | ||
| 29 | GYPA | 540402 | 11280 | -0.024 | -0.4325 | No | ||
| 30 | CEBPD | 3360176 | 11691 | -0.032 | -0.4541 | No | ||
| 31 | RBMX | 7100162 2900541 | 12929 | -0.064 | -0.5200 | No | ||
| 32 | ARG2 | 6940463 | 13609 | -0.093 | -0.5554 | No | ||
| 33 | NCAM1 | 3140026 | 14409 | -0.160 | -0.5964 | No | ||
| 34 | TYROBP | 2230020 | 15203 | -0.310 | -0.6352 | No | ||
| 35 | PAPSS2 | 870113 | 15511 | -0.416 | -0.6465 | No | ||
| 36 | BIN1 | 5420348 5670500 | 15690 | -0.493 | -0.6499 | No | ||
| 37 | PACSIN1 | 3870632 6370021 6900707 | 16628 | -1.026 | -0.6875 | No | ||
| 38 | ADSSL1 | 4850132 7000288 | 16664 | -1.053 | -0.6762 | No | ||
| 39 | ITGB2 | 6380348 | 17422 | -1.900 | -0.6931 | Yes | ||
| 40 | CD47 | 1850603 | 17731 | -2.476 | -0.6786 | Yes | ||
| 41 | ST3GAL6 | 5910184 | 17874 | -2.784 | -0.6512 | Yes | ||
| 42 | PPP2R5A | 1990497 | 17950 | -2.977 | -0.6179 | Yes | ||
| 43 | EVL | 1740113 | 18214 | -3.894 | -0.5831 | Yes | ||
| 44 | CD53 | 5550162 | 18221 | -3.932 | -0.5340 | Yes | ||
| 45 | CST3 | 7050452 | 18232 | -4.029 | -0.4839 | Yes | ||
| 46 | ZDHHC14 | 3780458 | 18297 | -4.337 | -0.4329 | Yes | ||
| 47 | HSD11B1 | 450066 5550408 | 18421 | -5.285 | -0.3731 | Yes | ||
| 48 | PGLYRP1 | 6760242 | 18442 | -5.508 | -0.3050 | Yes | ||
| 49 | RGS14 | 380086 | 18446 | -5.536 | -0.2356 | Yes | ||
| 50 | CYFIP2 | 520577 6040300 | 18449 | -5.552 | -0.1659 | Yes | ||
| 51 | RGS10 | 2340292 | 18498 | -6.090 | -0.0920 | Yes | ||
| 52 | CORO1A | 3140609 3190020 3190037 | 18574 | -7.823 | 0.0023 | Yes |

