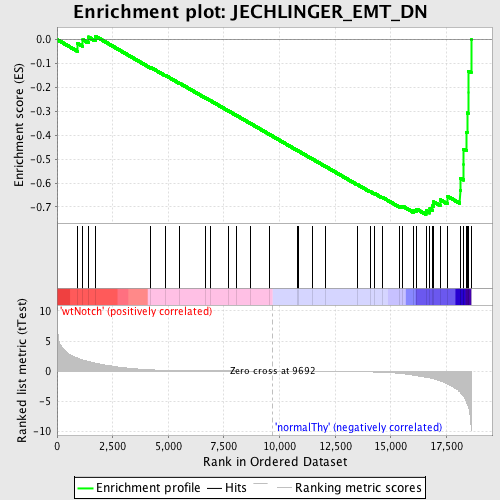
Profile of the Running ES Score & Positions of GeneSet Members on the Rank Ordered List
| Dataset | Set_03_wtNotch_versus_normalThy.phenotype_wtNotch_versus_normalThy.cls #wtNotch_versus_normalThy.phenotype_wtNotch_versus_normalThy.cls #wtNotch_versus_normalThy_repos |
| Phenotype | phenotype_wtNotch_versus_normalThy.cls#wtNotch_versus_normalThy_repos |
| Upregulated in class | normalThy |
| GeneSet | JECHLINGER_EMT_DN |
| Enrichment Score (ES) | -0.73146164 |
| Normalized Enrichment Score (NES) | -1.6072316 |
| Nominal p-value | 0.0018382353 |
| FDR q-value | 0.18840915 |
| FWER p-Value | 0.906 |
| PROBE | DESCRIPTION (from dataset) | GENE SYMBOL | GENE_TITLE | RANK IN GENE LIST | RANK METRIC SCORE | RUNNING ES | CORE ENRICHMENT | |
|---|---|---|---|---|---|---|---|---|
| 1 | STAT5A | 2680458 | 905 | 2.165 | -0.0156 | No | ||
| 2 | TGM2 | 5360452 | 1160 | 1.848 | -0.0010 | No | ||
| 3 | MYH9 | 3120091 4850292 | 1404 | 1.623 | 0.0107 | No | ||
| 4 | TGFB3 | 1070041 | 1717 | 1.334 | 0.0143 | No | ||
| 5 | AMD1 | 6290128 | 4209 | 0.217 | -0.1165 | No | ||
| 6 | ITGB5 | 70129 | 4878 | 0.142 | -0.1503 | No | ||
| 7 | THBS1 | 4560494 430288 | 5521 | 0.101 | -0.1833 | No | ||
| 8 | CTGF | 4540577 | 6689 | 0.055 | -0.2453 | No | ||
| 9 | FBP2 | 1580193 | 6900 | 0.050 | -0.2558 | No | ||
| 10 | ATF3 | 1940546 | 7704 | 0.033 | -0.2986 | No | ||
| 11 | TACSTD1 | 3780025 | 8053 | 0.026 | -0.3169 | No | ||
| 12 | SERPINB5 | 6940050 | 8707 | 0.015 | -0.3518 | No | ||
| 13 | F3 | 2940180 | 9553 | 0.002 | -0.3973 | No | ||
| 14 | PADI2 | 2940092 6420136 | 10812 | -0.017 | -0.4647 | No | ||
| 15 | HMMR | 5720315 6380168 | 10861 | -0.017 | -0.4670 | No | ||
| 16 | PKP1 | 1500433 | 11497 | -0.028 | -0.5008 | No | ||
| 17 | FOSB | 1940142 | 12064 | -0.040 | -0.5306 | No | ||
| 18 | KITLG | 2120047 6220300 | 13497 | -0.088 | -0.6064 | No | ||
| 19 | IRF6 | 840241 2640139 4050373 6840471 | 14068 | -0.126 | -0.6351 | No | ||
| 20 | CTSH | 60524 | 14270 | -0.146 | -0.6437 | No | ||
| 21 | NUMB | 2450735 3800253 6350040 | 14614 | -0.184 | -0.6594 | No | ||
| 22 | NNT | 540253 1170471 5550092 6760397 | 15402 | -0.369 | -0.6961 | No | ||
| 23 | CDH1 | 1940736 | 15523 | -0.423 | -0.6961 | No | ||
| 24 | TIMP3 | 1450504 1980270 | 16032 | -0.668 | -0.7133 | No | ||
| 25 | GRB7 | 2100471 | 16160 | -0.742 | -0.7087 | No | ||
| 26 | SGK | 1400131 2480056 | 16583 | -1.006 | -0.7161 | Yes | ||
| 27 | VAMP8 | 380411 1190139 | 16756 | -1.131 | -0.7081 | Yes | ||
| 28 | ATP1A1 | 5670451 | 16873 | -1.225 | -0.6956 | Yes | ||
| 29 | RARA | 4050161 | 16922 | -1.268 | -0.6788 | Yes | ||
| 30 | JUP | 2510671 | 17219 | -1.623 | -0.6699 | Yes | ||
| 31 | ITPR1 | 3450519 | 17548 | -2.119 | -0.6552 | Yes | ||
| 32 | ACTN4 | 3840301 4590390 7050132 | 18109 | -3.462 | -0.6324 | Yes | ||
| 33 | TIAM1 | 5420288 | 18120 | -3.517 | -0.5792 | Yes | ||
| 34 | KLF2 | 6860270 | 18274 | -4.232 | -0.5228 | Yes | ||
| 35 | FLNA | 5390193 | 18277 | -4.252 | -0.4579 | Yes | ||
| 36 | BCL6 | 940100 | 18397 | -5.006 | -0.3878 | Yes | ||
| 37 | ARHGEF1 | 610347 4850603 6420672 | 18432 | -5.416 | -0.3068 | Yes | ||
| 38 | EGR2 | 3800403 | 18475 | -5.788 | -0.2206 | Yes | ||
| 39 | DUSP1 | 6860121 | 18476 | -5.793 | -0.1321 | Yes | ||
| 40 | EGR1 | 4610347 | 18609 | -9.130 | 0.0004 | Yes |

