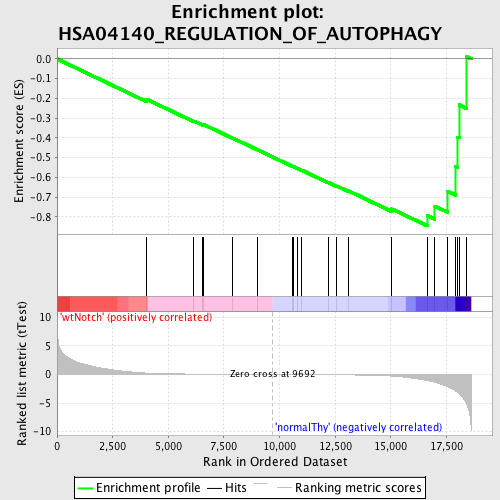
Profile of the Running ES Score & Positions of GeneSet Members on the Rank Ordered List
| Dataset | Set_03_wtNotch_versus_normalThy.phenotype_wtNotch_versus_normalThy.cls #wtNotch_versus_normalThy.phenotype_wtNotch_versus_normalThy.cls #wtNotch_versus_normalThy_repos |
| Phenotype | phenotype_wtNotch_versus_normalThy.cls#wtNotch_versus_normalThy_repos |
| Upregulated in class | normalThy |
| GeneSet | HSA04140_REGULATION_OF_AUTOPHAGY |
| Enrichment Score (ES) | -0.84625506 |
| Normalized Enrichment Score (NES) | -1.6591548 |
| Nominal p-value | 0.0 |
| FDR q-value | 0.26969138 |
| FWER p-Value | 0.554 |
| PROBE | DESCRIPTION (from dataset) | GENE SYMBOL | GENE_TITLE | RANK IN GENE LIST | RANK METRIC SCORE | RUNNING ES | CORE ENRICHMENT | |
|---|---|---|---|---|---|---|---|---|
| 1 | ATG7 | 3940619 | 4026 | 0.248 | -0.2041 | No | ||
| 2 | IFNA7 | 2510239 | 6149 | 0.073 | -0.3146 | No | ||
| 3 | PIK3R4 | 1990132 | 6533 | 0.060 | -0.3322 | No | ||
| 4 | PRKAA1 | 510156 | 6589 | 0.058 | -0.3323 | No | ||
| 5 | ATG5 | 6200433 5360324 | 7888 | 0.029 | -0.4006 | No | ||
| 6 | IFNA14 | 4540142 | 9012 | 0.010 | -0.4605 | No | ||
| 7 | IFNA13 | 1980086 | 10564 | -0.013 | -0.5433 | No | ||
| 8 | IFNA2 | 4150162 | 10628 | -0.014 | -0.5460 | No | ||
| 9 | ATG3 | 5550647 6350050 | 10790 | -0.016 | -0.5538 | No | ||
| 10 | IFNA4 | 1940025 | 10983 | -0.019 | -0.5632 | No | ||
| 11 | IFNA1 | 5390592 | 12197 | -0.043 | -0.6263 | No | ||
| 12 | IFNA6 | 5550414 | 12572 | -0.052 | -0.6438 | No | ||
| 13 | IFNG | 5670592 | 13106 | -0.070 | -0.6689 | No | ||
| 14 | IFNA5 | 4780072 | 15047 | -0.265 | -0.7601 | No | ||
| 15 | ULK2 | 50041 5050176 | 16651 | -1.045 | -0.7942 | Yes | ||
| 16 | PIK3C3 | 6590717 | 16982 | -1.326 | -0.7460 | Yes | ||
| 17 | BECN1 | 3840433 | 17553 | -2.125 | -0.6708 | Yes | ||
| 18 | ULK1 | 6100315 | 17921 | -2.898 | -0.5463 | Yes | ||
| 19 | ATG12 | 780167 | 18012 | -3.108 | -0.3963 | Yes | ||
| 20 | GABARAP | 1450286 | 18075 | -3.356 | -0.2326 | Yes | ||
| 21 | GABARAPL1 | 2810458 | 18419 | -5.255 | 0.0106 | Yes |

