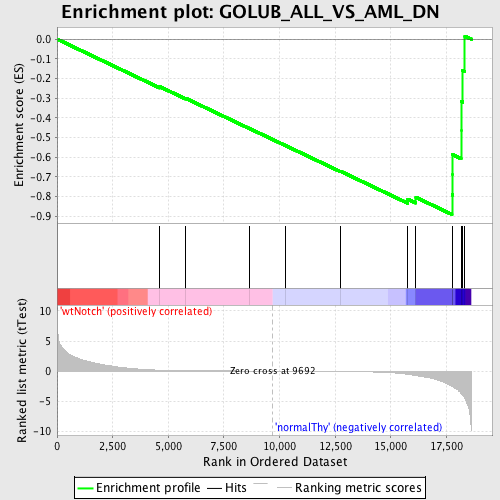
Profile of the Running ES Score & Positions of GeneSet Members on the Rank Ordered List
| Dataset | Set_03_wtNotch_versus_normalThy.phenotype_wtNotch_versus_normalThy.cls #wtNotch_versus_normalThy.phenotype_wtNotch_versus_normalThy.cls #wtNotch_versus_normalThy_repos |
| Phenotype | phenotype_wtNotch_versus_normalThy.cls#wtNotch_versus_normalThy_repos |
| Upregulated in class | normalThy |
| GeneSet | GOLUB_ALL_VS_AML_DN |
| Enrichment Score (ES) | -0.8907959 |
| Normalized Enrichment Score (NES) | -1.6074601 |
| Nominal p-value | 0.0 |
| FDR q-value | 0.20319231 |
| FWER p-Value | 0.906 |
| PROBE | DESCRIPTION (from dataset) | GENE SYMBOL | GENE_TITLE | RANK IN GENE LIST | RANK METRIC SCORE | RUNNING ES | CORE ENRICHMENT | |
|---|---|---|---|---|---|---|---|---|
| 1 | HOXA9 | 610494 4730040 5130601 | 4619 | 0.166 | -0.2417 | No | ||
| 2 | LYN | 6040600 | 5783 | 0.087 | -0.3008 | No | ||
| 3 | ATP6V0C | 1780609 | 8632 | 0.016 | -0.4532 | No | ||
| 4 | PPIF | 1740059 | 10274 | -0.008 | -0.5411 | No | ||
| 5 | CD33 | 3990735 | 12728 | -0.057 | -0.6707 | No | ||
| 6 | CFD | 2320736 | 15762 | -0.526 | -0.8129 | Yes | ||
| 7 | CTSD | 1070195 | 16128 | -0.728 | -0.8037 | Yes | ||
| 8 | SQSTM1 | 6550056 | 17750 | -2.527 | -0.7907 | Yes | ||
| 9 | LEPROT | 5130450 | 17776 | -2.580 | -0.6898 | Yes | ||
| 10 | FAH | 5390195 | 17781 | -2.590 | -0.5874 | Yes | ||
| 11 | ZYX | 4730068 | 18157 | -3.671 | -0.4621 | Yes | ||
| 12 | NFKBIA | 1570152 | 18160 | -3.680 | -0.3164 | Yes | ||
| 13 | CST3 | 7050452 | 18232 | -4.029 | -0.1606 | Yes | ||
| 14 | MCL1 | 1660672 | 18331 | -4.573 | 0.0153 | Yes |

