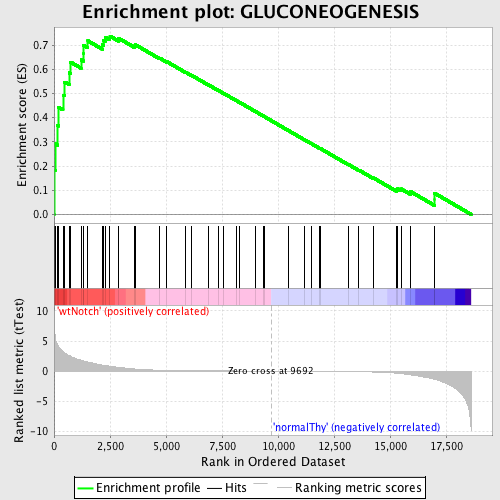
Profile of the Running ES Score & Positions of GeneSet Members on the Rank Ordered List
| Dataset | Set_03_wtNotch_versus_normalThy.phenotype_wtNotch_versus_normalThy.cls #wtNotch_versus_normalThy.phenotype_wtNotch_versus_normalThy.cls #wtNotch_versus_normalThy_repos |
| Phenotype | phenotype_wtNotch_versus_normalThy.cls#wtNotch_versus_normalThy_repos |
| Upregulated in class | wtNotch |
| GeneSet | GLUCONEOGENESIS |
| Enrichment Score (ES) | 0.737062 |
| Normalized Enrichment Score (NES) | 1.7110745 |
| Nominal p-value | 0.0 |
| FDR q-value | 0.031667836 |
| FWER p-Value | 0.28 |
| PROBE | DESCRIPTION (from dataset) | GENE SYMBOL | GENE_TITLE | RANK IN GENE LIST | RANK METRIC SCORE | RUNNING ES | CORE ENRICHMENT | |
|---|---|---|---|---|---|---|---|---|
| 1 | PFKM | 1990156 5720168 | 4 | 9.552 | 0.1828 | Yes | ||
| 2 | ALDOA | 6290672 | 47 | 5.798 | 0.2916 | Yes | ||
| 3 | PKM2 | 6520403 70500 | 158 | 4.287 | 0.3677 | Yes | ||
| 4 | LDHA | 2190594 | 205 | 4.012 | 0.4421 | Yes | ||
| 5 | ENO1 | 5340128 | 397 | 3.225 | 0.4936 | Yes | ||
| 6 | ALDH2 | 4230019 | 470 | 3.002 | 0.5472 | Yes | ||
| 7 | HK2 | 2640722 | 673 | 2.572 | 0.5856 | Yes | ||
| 8 | ALDH1B1 | 610195 | 735 | 2.470 | 0.6297 | Yes | ||
| 9 | ENO3 | 5270136 | 1206 | 1.805 | 0.6389 | Yes | ||
| 10 | PGAM1 | 2570133 | 1304 | 1.712 | 0.6665 | Yes | ||
| 11 | TPI1 | 1500215 2100154 | 1311 | 1.708 | 0.6989 | Yes | ||
| 12 | FBP1 | 1470762 | 1507 | 1.524 | 0.7176 | Yes | ||
| 13 | PGK1 | 1570494 630300 | 2167 | 1.001 | 0.7013 | Yes | ||
| 14 | PDHA1 | 5550397 | 2210 | 0.991 | 0.7180 | Yes | ||
| 15 | DLAT | 430452 | 2278 | 0.959 | 0.7328 | Yes | ||
| 16 | DLD | 4150403 6590341 | 2493 | 0.825 | 0.7371 | Yes | ||
| 17 | ALDH3A1 | 580095 | 2882 | 0.626 | 0.7282 | No | ||
| 18 | LDHC | 2030458 6100463 | 3598 | 0.357 | 0.6965 | No | ||
| 19 | GAPDH | 110022 430039 6220161 | 3637 | 0.342 | 0.7010 | No | ||
| 20 | ALDH3B1 | 4210010 6940403 | 4722 | 0.156 | 0.6456 | No | ||
| 21 | ADHFE1 | 1990673 6840022 | 5038 | 0.129 | 0.6311 | No | ||
| 22 | PFKP | 70138 6760040 1170278 | 5877 | 0.084 | 0.5876 | No | ||
| 23 | ADH7 | 60465 | 6116 | 0.074 | 0.5762 | No | ||
| 24 | FBP2 | 1580193 | 6900 | 0.050 | 0.5350 | No | ||
| 25 | PGM1 | 3840408 | 7344 | 0.040 | 0.5119 | No | ||
| 26 | ACYP1 | 6380403 | 7554 | 0.036 | 0.5014 | No | ||
| 27 | ADH4 | 6840301 | 8151 | 0.025 | 0.4697 | No | ||
| 28 | ALDH9A1 | 4810047 | 8256 | 0.023 | 0.4646 | No | ||
| 29 | ALDH1A1 | 6520706 | 8977 | 0.011 | 0.4260 | No | ||
| 30 | ALDH1A3 | 2100270 | 9368 | 0.005 | 0.4051 | No | ||
| 31 | PKLR | 1170400 2470114 | 9379 | 0.005 | 0.4046 | No | ||
| 32 | ACYP2 | 2510605 | 10465 | -0.011 | 0.3464 | No | ||
| 33 | PGM3 | 2570465 | 11179 | -0.023 | 0.3085 | No | ||
| 34 | GCK | 2370273 | 11481 | -0.028 | 0.2928 | No | ||
| 35 | PDHA2 | 2630438 | 11850 | -0.035 | 0.2737 | No | ||
| 36 | ALDOB | 4730324 | 11889 | -0.036 | 0.2723 | No | ||
| 37 | HK1 | 4280402 | 13130 | -0.071 | 0.2069 | No | ||
| 38 | ALDH1A2 | 2320301 | 13599 | -0.093 | 0.1835 | No | ||
| 39 | G6PC | 430093 | 14256 | -0.144 | 0.1509 | No | ||
| 40 | ALDOC | 450121 610427 | 15289 | -0.336 | 0.1018 | No | ||
| 41 | ADH1A | 3170427 | 15343 | -0.352 | 0.1057 | No | ||
| 42 | BPGM | 5080520 | 15493 | -0.405 | 0.1054 | No | ||
| 43 | HK3 | 3190288 6510142 | 15914 | -0.609 | 0.0945 | No | ||
| 44 | ENO2 | 2320068 | 16985 | -1.328 | 0.0623 | No | ||
| 45 | PDHB | 70215 610086 | 16987 | -1.330 | 0.0877 | No |

