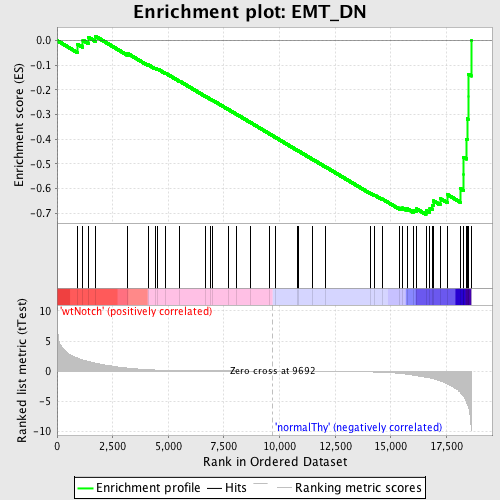
Profile of the Running ES Score & Positions of GeneSet Members on the Rank Ordered List
| Dataset | Set_03_wtNotch_versus_normalThy.phenotype_wtNotch_versus_normalThy.cls #wtNotch_versus_normalThy.phenotype_wtNotch_versus_normalThy.cls #wtNotch_versus_normalThy_repos |
| Phenotype | phenotype_wtNotch_versus_normalThy.cls#wtNotch_versus_normalThy_repos |
| Upregulated in class | normalThy |
| GeneSet | EMT_DN |
| Enrichment Score (ES) | -0.70441824 |
| Normalized Enrichment Score (NES) | -1.6115378 |
| Nominal p-value | 0.0018181818 |
| FDR q-value | 0.20511615 |
| FWER p-Value | 0.9 |
| PROBE | DESCRIPTION (from dataset) | GENE SYMBOL | GENE_TITLE | RANK IN GENE LIST | RANK METRIC SCORE | RUNNING ES | CORE ENRICHMENT | |
|---|---|---|---|---|---|---|---|---|
| 1 | STAT5A | 2680458 | 905 | 2.165 | -0.0145 | No | ||
| 2 | TGM2 | 5360452 | 1160 | 1.848 | 0.0010 | No | ||
| 3 | MYH9 | 3120091 4850292 | 1404 | 1.623 | 0.0135 | No | ||
| 4 | TGFB3 | 1070041 | 1717 | 1.334 | 0.0178 | No | ||
| 5 | PRKCZ | 3780279 | 3165 | 0.512 | -0.0521 | No | ||
| 6 | CA2 | 1660113 1660600 | 4086 | 0.237 | -0.0978 | No | ||
| 7 | CHKA | 510324 | 4399 | 0.192 | -0.1116 | No | ||
| 8 | TSC22D1 | 1340739 6040181 | 4529 | 0.176 | -0.1158 | No | ||
| 9 | ITGB5 | 70129 | 4878 | 0.142 | -0.1323 | No | ||
| 10 | THBS1 | 4560494 430288 | 5521 | 0.101 | -0.1652 | No | ||
| 11 | CTGF | 4540577 | 6689 | 0.055 | -0.2272 | No | ||
| 12 | FBP2 | 1580193 | 6900 | 0.050 | -0.2377 | No | ||
| 13 | KLF10 | 4850056 | 6976 | 0.048 | -0.2410 | No | ||
| 14 | ATF3 | 1940546 | 7704 | 0.033 | -0.2796 | No | ||
| 15 | TACSTD1 | 3780025 | 8053 | 0.026 | -0.2980 | No | ||
| 16 | SERPINB5 | 6940050 | 8707 | 0.015 | -0.3329 | No | ||
| 17 | F3 | 2940180 | 9553 | 0.002 | -0.3783 | No | ||
| 18 | PLK2 | 6450152 | 9827 | -0.002 | -0.3930 | No | ||
| 19 | PADI2 | 2940092 6420136 | 10812 | -0.017 | -0.4457 | No | ||
| 20 | HMMR | 5720315 6380168 | 10861 | -0.017 | -0.4480 | No | ||
| 21 | PKP1 | 1500433 | 11497 | -0.028 | -0.4818 | No | ||
| 22 | FOSB | 1940142 | 12064 | -0.040 | -0.5116 | No | ||
| 23 | IRF6 | 840241 2640139 4050373 6840471 | 14068 | -0.126 | -0.6175 | No | ||
| 24 | CTSH | 60524 | 14270 | -0.146 | -0.6260 | No | ||
| 25 | NUMB | 2450735 3800253 6350040 | 14614 | -0.184 | -0.6416 | No | ||
| 26 | NNT | 540253 1170471 5550092 6760397 | 15402 | -0.369 | -0.6781 | No | ||
| 27 | CDH1 | 1940736 | 15523 | -0.423 | -0.6779 | No | ||
| 28 | SAT1 | 4570463 | 15729 | -0.511 | -0.6809 | No | ||
| 29 | TIMP3 | 1450504 1980270 | 16032 | -0.668 | -0.6866 | No | ||
| 30 | GRB7 | 2100471 | 16160 | -0.742 | -0.6817 | No | ||
| 31 | SGK | 1400131 2480056 | 16583 | -1.006 | -0.6885 | Yes | ||
| 32 | VAMP8 | 380411 1190139 | 16756 | -1.131 | -0.6799 | Yes | ||
| 33 | ATP1A1 | 5670451 | 16873 | -1.225 | -0.6669 | Yes | ||
| 34 | RARA | 4050161 | 16922 | -1.268 | -0.6494 | Yes | ||
| 35 | JUP | 2510671 | 17219 | -1.623 | -0.6397 | Yes | ||
| 36 | ITPR1 | 3450519 | 17548 | -2.119 | -0.6239 | Yes | ||
| 37 | TIAM1 | 5420288 | 18120 | -3.517 | -0.5992 | Yes | ||
| 38 | KLF2 | 6860270 | 18274 | -4.232 | -0.5406 | Yes | ||
| 39 | FLNA | 5390193 | 18277 | -4.252 | -0.4736 | Yes | ||
| 40 | BCL6 | 940100 | 18397 | -5.006 | -0.4009 | Yes | ||
| 41 | ARHGEF1 | 610347 4850603 6420672 | 18432 | -5.416 | -0.3172 | Yes | ||
| 42 | EGR2 | 3800403 | 18475 | -5.788 | -0.2281 | Yes | ||
| 43 | DUSP1 | 6860121 | 18476 | -5.793 | -0.1367 | Yes | ||
| 44 | EGR1 | 4610347 | 18609 | -9.130 | 0.0004 | Yes |

